In reference to
where you have the range tool control the main top chart.
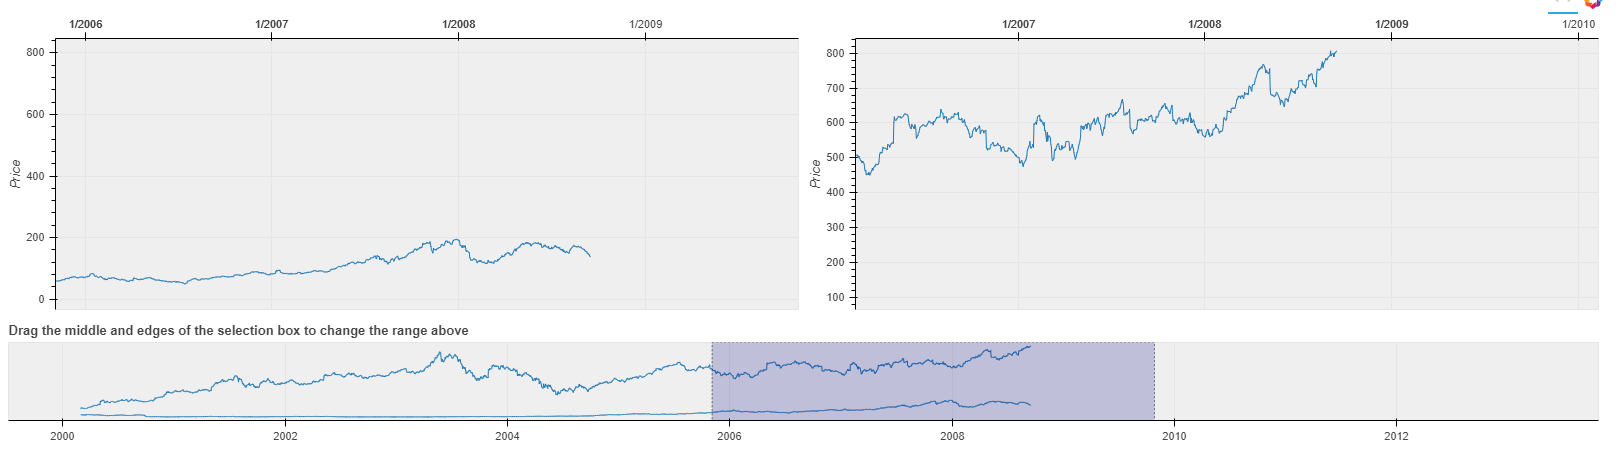
Can you modify this so that you can select over several charts? So far what I tried displays the charts but only the chart I synch with x_range is the chart that moves. I tried passing a list, a series, nothing works. Can someone assist?
Sample code:
import numpy as np
from bokeh.io import show
from bokeh.layouts import column
from bokeh.models import ColumnDataSource, RangeTool
from bokeh.plotting import figure
from bokeh.sampledata.stocks import AAPL, GOOG
from bokeh.layouts import gridplot

dates = np.array(AAPL['date'], dtype=np.datetime64)
source = ColumnDataSource(data=dict(date=dates, aapl=AAPL['adj_close'], goog=GOOG['adj_close']))

p1 = figure(plot_height=300, plot_width=800, tools="xpan", toolbar_location=None,
           x_axis_type="datetime", x_axis_location="above",
           background_fill_color="#efefef", x_range=(dates[1500], dates[2500]))
p1.line('date', 'aapl', source=source)
p1.yaxis.axis_label = 'Price'

p2 = figure(plot_height=300, plot_width=800, tools="xpan", toolbar_location=None,
           x_axis_type="datetime", x_axis_location="above",
           background_fill_color="#efefef", x_range=(dates[1500], dates[2500]))
p2.line('date', 'goog', source=source)
p2.yaxis.axis_label = 'Price'

p = gridplot([[p1,p2]])

select = figure(title="Drag the middle and edges of the selection box to change the range above",
                plot_height=130, plot_width=1600, y_range=p1.y_range,
                x_axis_type="datetime", y_axis_type=None,
                tools="", toolbar_location=None, background_fill_color="#efefef")

range_tool = RangeTool(x_range=p1.x_range)
range_tool.overlay.fill_color = "navy"
range_tool.overlay.fill_alpha = 0.2

select.line('date', 'aapl', source=source)
select.line('date', 'goog', source=source)
select.ygrid.grid_line_color = None
select.add_tools(range_tool)
select.toolbar.active_multi = range_tool

show(column(p, select))
Output: