I managed to install the crossfilter example and it is absolutely amazing.
I guess this is a stupid question…
Now how do I personalize it with my data?
Thanks so much!
Fabio
I managed to install the crossfilter example and it is absolutely amazing.
I guess this is a stupid question…
Now how do I personalize it with my data?
Thanks so much!
Fabio
Not a dumb question at all! If you look at the crossfilter_app.py file:
https://github.com/bokeh/bokeh/blob/master/examples/app/crossfilter/crossfilter_app.py
You can see this is all it does:
    @bokeh_app.route("/bokeh/crossfilter/")

    @object_page("crossfilter")

    def make_crossfilter():

                autompg['cyl'] = autompg['cyl'].astype(str)

                autompg['origin'] = autompg['origin'].astype(str)

                app = CrossFilter.create(df=autompg)

                return app
And that's really all you need to do too. Copy this script to a new one that passes in whatever Pandas DataFrame is is that you want to look at (with categorical columns converted to strings for now) instead of the "autompg" data. Then call bokeh-server with this new script for the --script argument. It would probably be good to add some kind of flexibility into the crossfilter as it is, to be able to specify a new data frame from the command line or similar. If you ever feel like taking a stab at improvements like that, a pull request would be very welcomed!
Thanks,
Bryan
On Mar 18, 2015, at 3:10 PM, Fabio Annovazzi <[email protected]> wrote:
I managed to install the crossfilter example and it is absolutely amazing.
I guess this is a stupid question...
Now how do I personalize it with my data?
Thanks so much!
Fabio
--
You received this message because you are subscribed to the Google Groups "Bokeh Discussion - Public" group.
To unsubscribe from this group and stop receiving emails from it, send an email to [email protected].
To post to this group, send email to [email protected].
To view this discussion on the web visit https://groups.google.com/a/continuum.io/d/msgid/bokeh/739ed1d4-49b8-4337-9b50-05ddab04b524%40continuum.io\.
For more options, visit https://groups.google.com/a/continuum.io/d/optout\.
I was just doing this, this morning, in fact and noticed that when I just dumped all my data in, it didn’t like blank cells. I didn’t have time to check out whether this is the CrossFilter or I just need to use a fillna.
In case you’re wondering what the magical autompg is, it’s just a pandas data frame.
Here’s my code:
201 data = pd.read_csv(‘/path/to/my_csv.csv’)
202 data[‘Scenario’] = data[‘Scenario’].astype(str)
203 data[‘Province’] = data[‘Province’].astype(str)
204 app = CrossFilter.create(df=data)
Once I’d cleaned up my csv so it was completely full, it worked straight out of the box (although the bar chart doesn’t like negative numbers)
On Wednesday, March 18, 2015 at 1:24:05 PM UTC-7, Bryan Van de ven wrote:
Not a dumb question at all! If you look at the crossfilter_app.py file:
[https://github.com/bokeh/bokeh/blob/master/examples/app/crossfilter/crossfilter_app.py](https://github.com/bokeh/bokeh/blob/master/examples/app/crossfilter/crossfilter_app.py)You can see this is all it does:
    @bokeh_app.route("/bokeh/crossfilter/")

    @object_page("crossfilter")

    def make_crossfilter():

                autompg['cyl'] = autompg['cyl'].astype(str)

                autompg['origin'] = autompg['origin'].astype(str)

                app = CrossFilter.create(df=autompg)

                return app
And that’s really all you need to do too. Copy this script to a new one that passes in whatever Pandas DataFrame is is that you want to look at (with categorical columns converted to strings for now) instead of the “autompg” data. Then call bokeh-server with this new script for the --script argument. It would probably be good to add some kind of flexibility into the crossfilter as it is, to be able to specify a new data frame from the command line or similar. If you ever feel like taking a stab at improvements like that, a pull request would be very welcomed!
Thanks,
Bryan
On Mar 18, 2015, at 3:10 PM, Fabio Annovazzi [email protected] wrote:
I managed to install the crossfilter example and it is absolutely amazing.
I guess this is a stupid question…
Now how do I personalize it with my data?
Thanks so much!
Fabio
–
You received this message because you are subscribed to the Google Groups “Bokeh Discussion - Public” group.To unsubscribe from this group and stop receiving emails from it, send an email to [email protected].
To post to this group, send email to [email protected].
To view this discussion on the web visit https://groups.google.com/a/continuum.io/d/msgid/bokeh/739ed1d4-49b8-4337-9b50-05ddab04b524%40continuum.io.
For more options, visit https://groups.google.com/a/continuum.io/d/optout.
pretty amazing ![]()
On Wed, Mar 18, 2015 at 9:30 PM, Sarah Bird [email protected] wrote:
I was just doing this, this morning, in fact and noticed that when I just dumped all my data in, it didn’t like blank cells. I didn’t have time to check out whether this is the CrossFilter or I just need to use a fillna.
In case you’re wondering what the magical autompg is, it’s just a pandas data frame.
Here’s my code:
201 data = pd.read_csv(‘/path/to/my_csv.csv’)
202 data[‘Scenario’] = data[‘Scenario’].astype(str)
203 data[‘Province’] = data[‘Province’].astype(str)
204 app = CrossFilter.create(df=data)Once I’d cleaned up my csv so it was completely full, it worked straight out of the box (although the bar chart doesn’t like negative numbers)
On Wednesday, March 18, 2015 at 1:24:05 PM UTC-7, Bryan Van de ven wrote:
Not a dumb question at all! If you look at the crossfilter_app.py file:
[https://github.com/bokeh/bokeh/blob/master/examples/app/crossfilter/crossfilter_app.py](https://github.com/bokeh/bokeh/blob/master/examples/app/crossfilter/crossfilter_app.py)You can see this is all it does:
    @bokeh_app.route("/bokeh/crossfilter/")

    @object_page("crossfilter")

    def make_crossfilter():

                autompg['cyl'] = autompg['cyl'].astype(str)

                autompg['origin'] = autompg['origin'].astype(str)

                app = CrossFilter.create(df=autompg)

                return app
And that’s really all you need to do too. Copy this script to a new one that passes in whatever Pandas DataFrame is is that you want to look at (with categorical columns converted to strings for now) instead of the “autompg” data. Then call bokeh-server with this new script for the --script argument. It would probably be good to add some kind of flexibility into the crossfilter as it is, to be able to specify a new data frame from the command line or similar. If you ever feel like taking a stab at improvements like that, a pull request would be very welcomed!
Thanks,
Bryan
On Mar 18, 2015, at 3:10 PM, Fabio Annovazzi [email protected] wrote:
I managed to install the crossfilter example and it is absolutely amazing.
I guess this is a stupid question…
Now how do I personalize it with my data?
Thanks so much!
Fabio
–
You received this message because you are subscribed to the Google Groups “Bokeh Discussion - Public” group.To unsubscribe from this group and stop receiving emails from it, send an email to [email protected].
To post to this group, send email to [email protected].
To view this discussion on the web visit https://groups.google.com/a/continuum.io/d/msgid/bokeh/739ed1d4-49b8-4337-9b50-05ddab04b524%40continuum.io.
For more options, visit https://groups.google.com/a/continuum.io/d/optout.
–
You received this message because you are subscribed to the Google Groups “Bokeh Discussion - Public” group.
To unsubscribe from this group and stop receiving emails from it, send an email to [email protected].
To post to this group, send email to [email protected].
To view this discussion on the web visit https://groups.google.com/a/continuum.io/d/msgid/bokeh/e5d87604-a464-459e-a697-930deb2cc181%40continuum.io.
For more options, visit https://groups.google.com/a/continuum.io/d/optout.
–
Fabio Annovazzi
tel. 0041 (0)78-6334750
Skype: fabio_annovazzi
www.logeeka…com
Thanks Saray and Brian,
it worked fine. Great!. Very minor issues, for instance for some reason it leaves a bigger gap in the bar chart between two years.
There is no way to “preset” the crossfilter to a particular views, isn’t there? I would like to to load with bars instead of scatter, and with a different set of metrics on the X and Y axis…
Great work!
Fabio
On Wednesday, March 18, 2015 at 9:30:08 PM UTC+1, Sarah Bird wrote:
Not a dumb question at all! If you look at the crossfilter_app.py file:
[https://github.com/bokeh/bokeh/blob/master/examples/app/crossfilter/crossfilter_app.py](https://github.com/bokeh/bokeh/blob/master/examples/app/crossfilter/crossfilter_app.py)You can see this is all it does:
    @bokeh_app.route("/bokeh/crossfilter/")

    @object_page("crossfilter")

    def make_crossfilter():

                autompg['cyl'] = autompg['cyl'].astype(str)

                autompg['origin'] = autompg['origin'].astype(str)

                app = CrossFilter.create(df=autompg)

                return app
And that’s really all you need to do too. Copy this script to a new one that passes in whatever Pandas DataFrame is is that you want to look at (with categorical columns converted to strings for now) instead of the “autompg” data. Then call bokeh-server with this new script for the --script argument. It would probably be good to add some kind of flexibility into the crossfilter as it is, to be able to specify a new data frame from the command line or similar. If you ever feel like taking a stab at improvements like that, a pull request would be very welcomed!
Thanks,
Bryan
On Mar 18, 2015, at 3:10 PM, Fabio Annovazzi [email protected] wrote:
I managed to install the crossfilter example and it is absolutely amazing.
I guess this is a stupid question…
Now how do I personalize it with my data?
Thanks so much!
Fabio
–
You received this message because you are subscribed to the Google Groups “Bokeh Discussion - Public” group.To unsubscribe from this group and stop receiving emails from it, send an email to [email protected].
To post to this group, send email to [email protected].
To view this discussion on the web visit https://groups.google.com/a/continuum.io/d/msgid/bokeh/739ed1d4-49b8-4337-9b50-05ddab04b524%40continuum.io.
For more options, visit https://groups.google.com/a/continuum.io/d/optout.
I was just doing this, this morning, in fact and noticed that when I just dumped all my data in, it didn’t like blank cells. I didn’t have time to check out whether this is the CrossFilter or I just need to use a fillna.
In case you’re wondering what the magical autompg is, it’s just a pandas data frame.
Here’s my code:
201 data = pd.read_csv(‘/path/to/my_csv.csv’)
202 data[‘Scenario’] = data[‘Scenario’].astype(str)
203 data[‘Province’] = data[‘Province’].astype(str)
204 app = CrossFilter.create(df=data)Once I’d cleaned up my csv so it was completely full, it worked straight out of the box (although the bar chart doesn’t like negative numbers)
On Wednesday, March 18, 2015 at 1:24:05 PM UTC-7, Bryan Van de ven wrote:
Hi Fabio,
Bar chart formatting - that’s a funny one - may well be a bug, if you’re able to share some data, maybe we can check it out. (there are other issues with bar - like not handling negative numbers)
I’m not aware of an out of the box way to preset things. I just found these plugins https://github.com/bokeh/bokeh/blob/master/bokeh/crossfilter/plugins.py#L12 - I have never used these so not sure on the mileage, maybe @rothnic will be able to help. But a quick look at them and I think it’s not what you want, but its python, so you could check out the code here https://github.com/bokeh/bokeh/blob/master/bokeh/crossfilter/models.py and then subclass CrossFilter and have at it.
Hopefully someone else will be more use to you on this one!
On Thu, Mar 19, 2015 at 3:30 AM, Fabio Annovazzi [email protected] wrote:
Thanks Saray and Brian,
it worked fine. Great!. Very minor issues, for instance for some reason it leaves a bigger gap in the bar chart between two years.
There is no way to “preset” the crossfilter to a particular views, isn’t there? I would like to to load with bars instead of scatter, and with a different set of metrics on the X and Y axis…
Great work!
Fabio
On Wednesday, March 18, 2015 at 9:30:08 PM UTC+1, Sarah Bird wrote:
I was just doing this, this morning, in fact and noticed that when I just dumped all my data in, it didn’t like blank cells. I didn’t have time to check out whether this is the CrossFilter or I just need to use a fillna.
In case you’re wondering what the magical autompg is, it’s just a pandas data frame.
Here’s my code:
201 data = pd.read_csv(‘/path/to/my_csv.csv’)
202 data[‘Scenario’] = data[‘Scenario’].astype(str)
203 data[‘Province’] = data[‘Province’].astype(str)
204 app = CrossFilter.create(df=data)Once I’d cleaned up my csv so it was completely full, it worked straight out of the box (although the bar chart doesn’t like negative numbers)
On Wednesday, March 18, 2015 at 1:24:05 PM UTC-7, Bryan Van de ven wrote:
Not a dumb question at all! If you look at the crossfilter_app.py file:
[https://github.com/bokeh/bokeh/blob/master/examples/app/crossfilter/crossfilter_app.py](https://github.com/bokeh/bokeh/blob/master/examples/app/crossfilter/crossfilter_app.py)You can see this is all it does:
    @bokeh_app.route("/bokeh/crossfilter/")

    @object_page("crossfilter")

    def make_crossfilter():

                autompg['cyl'] = autompg['cyl'].astype(str)

                autompg['origin'] = autompg['origin'].astype(str)

                app = CrossFilter.create(df=autompg)

                return app
And that’s really all you need to do too. Copy this script to a new one that passes in whatever Pandas DataFrame is is that you want to look at (with categorical columns converted to strings for now) instead of the “autompg” data. Then call bokeh-server with this new script for the --script argument. It would probably be good to add some kind of flexibility into the crossfilter as it is, to be able to specify a new data frame from the command line or similar. If you ever feel like taking a stab at improvements like that, a pull request would be very welcomed!
Thanks,
Bryan
On Mar 18, 2015, at 3:10 PM, Fabio Annovazzi [email protected] wrote:
I managed to install the crossfilter example and it is absolutely amazing.
I guess this is a stupid question…
Now how do I personalize it with my data?
Thanks so much!
Fabio
–
You received this message because you are subscribed to the Google Groups “Bokeh Discussion - Public” group.To unsubscribe from this group and stop receiving emails from it, send an email to [email protected].
To post to this group, send email to [email protected].
To view this discussion on the web visit https://groups.google.com/a/continuum.io/d/msgid/bokeh/739ed1d4-49b8-4337-9b50-05ddab04b524%40continuum.io.
For more options, visit https://groups.google.com/a/continuum.io/d/optout.
–
You received this message because you are subscribed to the Google Groups “Bokeh Discussion - Public” group.
To unsubscribe from this group and stop receiving emails from it, send an email to [email protected].
To post to this group, send email to [email protected].
To view this discussion on the web visit https://groups.google.com/a/continuum.io/d/msgid/bokeh/459eda3a-3394-4a6c-9e3a-f5841e1b7913%40continuum.io.
For more options, visit https://groups.google.com/a/continuum.io/d/optout.
Hi Sarah,
Yes of course, no problem, The code is attached, with the csv.
Thanks again for the links!
Best regards
Fabio
crossfilter_app_cruises.py (1.51 KB)
cruise_ratings.csv (758 KB)
On Thursday, March 19, 2015 at 3:49:03 PM UTC+1, Sarah Bird wrote:
Hi Fabio,
- Bar chart formatting - that’s a funny one - may well be a bug, if you’re able to share some data, maybe we can check it out. (there are other issues with bar - like not handling negative numbers)
- I’m not aware of an out of the box way to preset things. I just found these plugins https://github.com/bokeh/bokeh/blob/master/bokeh/crossfilter/plugins.py#L12 - I have never used these so not sure on the mileage, maybe @rothnic will be able to help. But a quick look at them and I think it’s not what you want, but its python, so you could check out the code here https://github.com/bokeh/bokeh/blob/master/bokeh/crossfilter/models.py and then subclass CrossFilter and have at it.
Hopefully someone else will be more use to you on this one!
On Thu, Mar 19, 2015 at 3:30 AM, Fabio Annovazzi [email protected] wrote:
Thanks Saray and Brian,
it worked fine. Great!. Very minor issues, for instance for some reason it leaves a bigger gap in the bar chart between two years.
There is no way to “preset” the crossfilter to a particular views, isn’t there? I would like to to load with bars instead of scatter, and with a different set of metrics on the X and Y axis…
Great work!
Fabio
On Wednesday, March 18, 2015 at 9:30:08 PM UTC+1, Sarah Bird wrote:
Not a dumb question at all! If you look at the crossfilter_app.py file:
[https://github.com/bokeh/bokeh/blob/master/examples/app/crossfilter/crossfilter_app.py](https://github.com/bokeh/bokeh/blob/master/examples/app/crossfilter/crossfilter_app.py)You can see this is all it does:
    @bokeh_app.route("/bokeh/crossfilter/")

    @object_page("crossfilter")

    def make_crossfilter():

                autompg['cyl'] = autompg['cyl'].astype(str)

                autompg['origin'] = autompg['origin'].astype(str)

                app = CrossFilter.create(df=autompg)

                return app
And that’s really all you need to do too. Copy this script to a new one that passes in whatever Pandas DataFrame is is that you want to look at (with categorical columns converted to strings for now) instead of the “autompg” data. Then call bokeh-server with this new script for the --script argument. It would probably be good to add some kind of flexibility into the crossfilter as it is, to be able to specify a new data frame from the command line or similar. If you ever feel like taking a stab at improvements like that, a pull request would be very welcomed!
Thanks,
Bryan
On Mar 18, 2015, at 3:10 PM, Fabio Annovazzi [email protected] wrote:
I managed to install the crossfilter example and it is absolutely amazing.
I guess this is a stupid question…
Now how do I personalize it with my data?
Thanks so much!
Fabio
–
You received this message because you are subscribed to the Google Groups “Bokeh Discussion - Public” group.To unsubscribe from this group and stop receiving emails from it, send an email to [email protected].
To post to this group, send email to [email protected].
To view this discussion on the web visit https://groups.google.com/a/continuum.io/d/msgid/bokeh/739ed1d4-49b8-4337-9b50-05ddab04b524%40continuum.io.
For more options, visit https://groups.google.com/a/continuum.io/d/optout.
I was just doing this, this morning, in fact and noticed that when I just dumped all my data in, it didn’t like blank cells. I didn’t have time to check out whether this is the CrossFilter or I just need to use a fillna.
In case you’re wondering what the magical autompg is, it’s just a pandas data frame.
Here’s my code:
201 data = pd.read_csv(‘/path/to/my_csv.csv’)
202 data[‘Scenario’] = data[‘Scenario’].astype(str)
203 data[‘Province’] = data[‘Province’].astype(str)
204 app = CrossFilter.create(df=data)Once I’d cleaned up my csv so it was completely full, it worked straight out of the box (although the bar chart doesn’t like negative numbers)
On Wednesday, March 18, 2015 at 1:24:05 PM UTC-7, Bryan Van de ven wrote:
–
You received this message because you are subscribed to the Google Groups “Bokeh Discussion - Public” group.
To unsubscribe from this group and stop receiving emails from it, send an email to [email protected].
To post to this group, send email to [email protected].
To view this discussion on the web visit https://groups.google.com/a/continuum.io/d/msgid/bokeh/459eda3a-3394-4a6c-9e3a-f5841e1b7913%40continuum.io.
For more options, visit https://groups.google.com/a/continuum.io/d/optout.
Sorry, thought I responded to this earlier. Must have gone to draft or something. If you’d like to customize the CrossFilter, then hopefully most things you’d want to customize would either be via a prop just like how df is used (HasProps), or by creating a custom plugin. This is in the cf init method:
if ‘plot_type’ not in kwargs:
kwargs[‘plot_type’] = “scatter”
if ‘agg’ not in kwargs:
kwargs[‘agg’] = ‘sum’
This shows how it will accept those kwarg options to set the current plot and aggregation type. By passing this in initially, it should also set the starting options as well. This is described in the docstring. The other option is to use a plugin, if you want to create a custom chart type. Eventually I would like the plugins to utilize the chart builders, but I’m waiting until that has stabilized a bit. If you look at the line chart plugin (https://github.com/bokeh/bokeh/blob/master/bokeh/crossfilter/plugins.py#L254), that is a good example of the most simple plugin you can create. The majority of the plugin functionality can be overridden when subclassing. I did notice that I need to accept a custom input of this plot map, which associates a plot name with a plugin: https://github.com/bokeh/bokeh/blob/master/bokeh/crossfilter/models.py#L128
For the issue with the bar chart, yeah the original version was having issues and I tried to fix it up. I think the problem occurs by trying to handle discrete and continuous data. Again, I’d prefer to use the bar chart builder and avoid having to develop a one-off bar chart plotting utility.
On Thu, Mar 19, 2015 at 10:11 AM, Fabio Annovazzi [email protected] wrote:
Hi Sarah,
Yes of course, no problem, The code is attached, with the csv.
Thanks again for the links!
Best regards
Fabio
On Thursday, March 19, 2015 at 3:49:03 PM UTC+1, Sarah Bird wrote:
Hi Fabio,
- Bar chart formatting - that’s a funny one - may well be a bug, if you’re able to share some data, maybe we can check it out. (there are other issues with bar - like not handling negative numbers)
- I’m not aware of an out of the box way to preset things. I just found these plugins https://github.com/bokeh/bokeh/blob/master/bokeh/crossfilter/plugins.py#L12 - I have never used these so not sure on the mileage, maybe @rothnic will be able to help. But a quick look at them and I think it’s not what you want, but its python, so you could check out the code here https://github.com/bokeh/bokeh/blob/master/bokeh/crossfilter/models.py and then subclass CrossFilter and have at it.
Hopefully someone else will be more use to you on this one!
On Thu, Mar 19, 2015 at 3:30 AM, Fabio Annovazzi [email protected] wrote:
Thanks Saray and Brian,
it worked fine. Great!. Very minor issues, for instance for some reason it leaves a bigger gap in the bar chart between two years.
There is no way to “preset” the crossfilter to a particular views, isn’t there? I would like to to load with bars instead of scatter, and with a different set of metrics on the X and Y axis…
Great work!
Fabio
On Wednesday, March 18, 2015 at 9:30:08 PM UTC+1, Sarah Bird wrote:
I was just doing this, this morning, in fact and noticed that when I just dumped all my data in, it didn’t like blank cells. I didn’t have time to check out whether this is the CrossFilter or I just need to use a fillna.
In case you’re wondering what the magical autompg is, it’s just a pandas data frame.
Here’s my code:
201 data = pd.read_csv(‘/path/to/my_csv.csv’)
202 data[‘Scenario’] = data[‘Scenario’].astype(str)
203 data[‘Province’] = data[‘Province’].astype(str)
204 app = CrossFilter.create(df=data)Once I’d cleaned up my csv so it was completely full, it worked straight out of the box (although the bar chart doesn’t like negative numbers)
On Wednesday, March 18, 2015 at 1:24:05 PM UTC-7, Bryan Van de ven wrote:
Not a dumb question at all! If you look at the crossfilter_app.py file:
[https://github.com/bokeh/bokeh/blob/master/examples/app/crossfilter/crossfilter_app.py](https://github.com/bokeh/bokeh/blob/master/examples/app/crossfilter/crossfilter_app.py)You can see this is all it does:
    @bokeh_app.route("/bokeh/crossfilter/")

    @object_page("crossfilter")

    def make_crossfilter():

                autompg['cyl'] = autompg['cyl'].astype(str)

                autompg['origin'] = autompg['origin'].astype(str)

                app = CrossFilter.create(df=autompg)

                return app
And that’s really all you need to do too. Copy this script to a new one that passes in whatever Pandas DataFrame is is that you want to look at (with categorical columns converted to strings for now) instead of the “autompg” data. Then call bokeh-server with this new script for the --script argument. It would probably be good to add some kind of flexibility into the crossfilter as it is, to be able to specify a new data frame from the command line or similar. If you ever feel like taking a stab at improvements like that, a pull request would be very welcomed!
Thanks,
Bryan
On Mar 18, 2015, at 3:10 PM, Fabio Annovazzi [email protected] wrote:
I managed to install the crossfilter example and it is absolutely amazing.
I guess this is a stupid question…
Now how do I personalize it with my data?
Thanks so much!
Fabio
–
You received this message because you are subscribed to the Google Groups “Bokeh Discussion - Public” group.To unsubscribe from this group and stop receiving emails from it, send an email to [email protected].
To post to this group, send email to [email protected].
To view this discussion on the web visit https://groups.google.com/a/continuum.io/d/msgid/bokeh/739ed1d4-49b8-4337-9b50-05ddab04b524%40continuum.io.
For more options, visit https://groups.google.com/a/continuum.io/d/optout.
–
You received this message because you are subscribed to the Google Groups “Bokeh Discussion - Public” group.
To unsubscribe from this group and stop receiving emails from it, send an email to [email protected].
To post to this group, send email to [email protected].
To view this discussion on the web visit https://groups.google.com/a/continuum.io/d/msgid/bokeh/459eda3a-3394-4a6c-9e3a-f5841e1b7913%40continuum.io.
For more options, visit https://groups.google.com/a/continuum.io/d/optout.
–
You received this message because you are subscribed to the Google Groups “Bokeh Discussion - Public” group.
To unsubscribe from this group and stop receiving emails from it, send an email to [email protected].
To post to this group, send email to [email protected].
To view this discussion on the web visit https://groups.google.com/a/continuum.io/d/msgid/bokeh/edd262ac-5d53-449b-90a3-47d925011ccb%40continuum.io.
For more options, visit https://groups.google.com/a/continuum.io/d/optout.
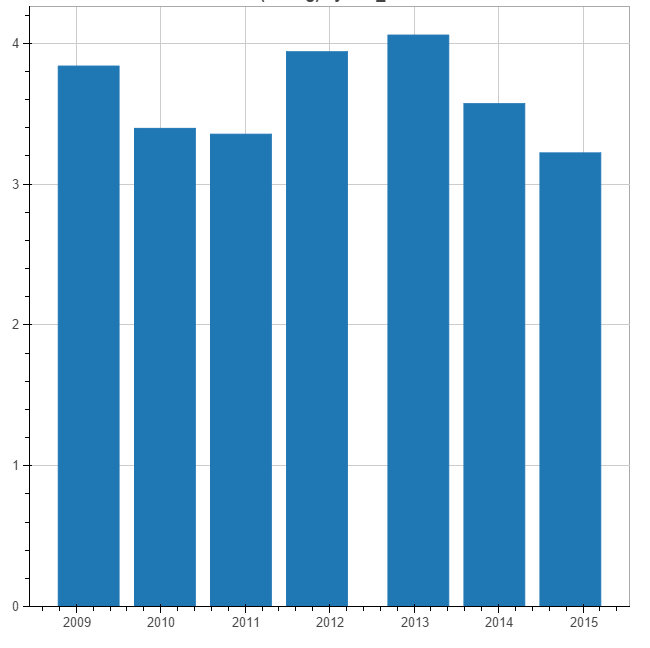
I went back and played with crossfilter a bit and found the issue you are having is primarily due to your classification of your columns. The year is not a traditional numerical/continuous data type, which is how it is treated as an integer. If you make it a string, then it will be treated as discrete data and the bars will be lined up correctly. The reason they aren’t lined up is because the bar plot sees it as continuous data that should be converted to N discrete bins.
Something I’d like to do is gracefully interpret columns. For example, I could look at a column with a small number of integers and know that this is likely categorical/discrete data. it ends up being fairly difficult to do this in a way that can handle all possible conditions. One simple fix would be to avoid the binning of continuous data if there are fewer bins than I’m looking for.
I did find some things I wanted to fix with the bar chart, but for the referenced case of mis-alignment, that is a pre-processing issue for now. I’ll create a pull request for those changes here soon.
On Thursday, March 19, 2015 at 5:30:45 AM UTC-5, Fabio Annovazzi wrote:
Thanks Saray and Brian,
it worked fine. Great!. Very minor issues, for instance for some reason it leaves a bigger gap in the bar chart between two years.
There is no way to “preset” the crossfilter to a particular views, isn’t there? I would like to to load with bars instead of scatter, and with a different set of metrics on the X and Y axis…
Great work!
Fabio
On Wednesday, March 18, 2015 at 9:30:08 PM UTC+1, Sarah Bird wrote:
Not a dumb question at all! If you look at the crossfilter_app.py file:
[https://github.com/bokeh/bokeh/blob/master/examples/app/crossfilter/crossfilter_app.py](https://github.com/bokeh/bokeh/blob/master/examples/app/crossfilter/crossfilter_app.py)You can see this is all it does:
    @bokeh_app.route("/bokeh/crossfilter/")

    @object_page("crossfilter")

    def make_crossfilter():

                autompg['cyl'] = autompg['cyl'].astype(str)

                autompg['origin'] = autompg['origin'].astype(str)

                app = CrossFilter.create(df=autompg)

                return app
And that’s really all you need to do too. Copy this script to a new one that passes in whatever Pandas DataFrame is is that you want to look at (with categorical columns converted to strings for now) instead of the “autompg” data. Then call bokeh-server with this new script for the --script argument. It would probably be good to add some kind of flexibility into the crossfilter as it is, to be able to specify a new data frame from the command line or similar. If you ever feel like taking a stab at improvements like that, a pull request would be very welcomed!
Thanks,
Bryan
On Mar 18, 2015, at 3:10 PM, Fabio Annovazzi [email protected] wrote:
I managed to install the crossfilter example and it is absolutely amazing.
I guess this is a stupid question…
Now how do I personalize it with my data?
Thanks so much!
Fabio
–
You received this message because you are subscribed to the Google Groups “Bokeh Discussion - Public” group.To unsubscribe from this group and stop receiving emails from it, send an email to [email protected].
To post to this group, send email to [email protected].
To view this discussion on the web visit https://groups.google.com/a/continuum.io/d/msgid/bokeh/739ed1d4-49b8-4337-9b50-05ddab04b524%40continuum.io.
For more options, visit https://groups.google.com/a/continuum.io/d/optout.
I was just doing this, this morning, in fact and noticed that when I just dumped all my data in, it didn’t like blank cells. I didn’t have time to check out whether this is the CrossFilter or I just need to use a fillna.
In case you’re wondering what the magical autompg is, it’s just a pandas data frame.
Here’s my code:
201 data = pd.read_csv(‘/path/to/my_csv.csv’)
202 data[‘Scenario’] = data[‘Scenario’].astype(str)
203 data[‘Province’] = data[‘Province’].astype(str)
204 app = CrossFilter.create(df=data)Once I’d cleaned up my csv so it was completely full, it worked straight out of the box (although the bar chart doesn’t like negative numbers)
On Wednesday, March 18, 2015 at 1:24:05 PM UTC-7, Bryan Van de ven wrote:
Hi Nick,
Again thanks for the great work! Bokeh crossfilter is realy cool!
Converting the Year to str did not work for me I think because I only have another numeric field, Rating.
So if I convert Year to string it returns me an error when it loads the chart (see below) since the dashboard initially loads as a scatter that needs two numerical fields. Or at least that is what I think happens.
File “C:\Users\fabio\Anaconda\lib\site-packages\bokeh\crossfilter\models.py”, line 283, in make_plot_choices
x, y = [x['name'] for x in self.continuous_columns()[:2]]
ValueError: need more than 1 value to unpack
Best regards
Fabio
On Tue, Mar 24, 2015 at 9:49 PM, Nick Roth [email protected] wrote:
I went back and played with crossfilter a bit and found the issue you are having is primarily due to your classification of your columns. The year is not a traditional numerical/continuous data type, which is how it is treated as an integer. If you make it a string, then it will be treated as discrete data and the bars will be lined up correctly. The reason they aren’t lined up is because the bar plot sees it as continuous data that should be converted to N discrete bins.
Something I’d like to do is gracefully interpret columns. For example, I could look at a column with a small number of integers and know that this is likely categorical/discrete data. it ends up being fairly difficult to do this in a way that can handle all possible conditions. One simple fix would be to avoid the binning of continuous data if there are fewer bins than I’m looking for.
I did find some things I wanted to fix with the bar chart, but for the referenced case of mis-alignment, that is a pre-processing issue for now. I’ll create a pull request for those changes here soon.
On Thursday, March 19, 2015 at 5:30:45 AM UTC-5, Fabio Annovazzi wrote:
Thanks Saray and Brian,
it worked fine. Great!. Very minor issues, for instance for some reason it leaves a bigger gap in the bar chart between two years.
There is no way to “preset” the crossfilter to a particular views, isn’t there? I would like to to load with bars instead of scatter, and with a different set of metrics on the X and Y axis…
Great work!
Fabio
On Wednesday, March 18, 2015 at 9:30:08 PM UTC+1, Sarah Bird wrote:
I was just doing this, this morning, in fact and noticed that when I just dumped all my data in, it didn’t like blank cells. I didn’t have time to check out whether this is the CrossFilter or I just need to use a fillna.
In case you’re wondering what the magical autompg is, it’s just a pandas data frame.
Here’s my code:
201 data = pd.read_csv(‘/path/to/my_csv.csv’)
202 data[‘Scenario’] = data[‘Scenario’].astype(str)
203 data[‘Province’] = data[‘Province’].astype(str)
204 app = CrossFilter.create(df=data)Once I’d cleaned up my csv so it was completely full, it worked straight out of the box (although the bar chart doesn’t like negative numbers)
On Wednesday, March 18, 2015 at 1:24:05 PM UTC-7, Bryan Van de ven wrote:
Not a dumb question at all! If you look at the crossfilter_app.py file:
[https://github.com/bokeh/bokeh/blob/master/examples/app/crossfilter/crossfilter_app.py](https://github.com/bokeh/bokeh/blob/master/examples/app/crossfilter/crossfilter_app.py)You can see this is all it does:
    @bokeh_app.route("/bokeh/crossfilter/")

    @object_page("crossfilter")

    def make_crossfilter():

                autompg['cyl'] = autompg['cyl'].astype(str)

                autompg['origin'] = autompg['origin'].astype(str)

                app = CrossFilter.create(df=autompg)

                return app
And that’s really all you need to do too. Copy this script to a new one that passes in whatever Pandas DataFrame is is that you want to look at (with categorical columns converted to strings for now) instead of the “autompg” data. Then call bokeh-server with this new script for the --script argument. It would probably be good to add some kind of flexibility into the crossfilter as it is, to be able to specify a new data frame from the command line or similar. If you ever feel like taking a stab at improvements like that, a pull request would be very welcomed!
Thanks,
Bryan
On Mar 18, 2015, at 3:10 PM, Fabio Annovazzi [email protected] wrote:
I managed to install the crossfilter example and it is absolutely amazing.
I guess this is a stupid question…
Now how do I personalize it with my data?
Thanks so much!
Fabio
–
You received this message because you are subscribed to the Google Groups “Bokeh Discussion - Public” group.To unsubscribe from this group and stop receiving emails from it, send an email to [email protected].
To post to this group, send email to [email protected].
To view this discussion on the web visit https://groups.google.com/a/continuum.io/d/msgid/bokeh/739ed1d4-49b8-4337-9b50-05ddab04b524%40continuum.io.
For more options, visit https://groups.google.com/a/continuum.io/d/optout.
–
You received this message because you are subscribed to the Google Groups “Bokeh Discussion - Public” group.
To unsubscribe from this group and stop receiving emails from it, send an email to [email protected].
To post to this group, send email to [email protected].
To view this discussion on the web visit https://groups.google.com/a/continuum.io/d/msgid/bokeh/39e4bac7-3348-4d4f-9652-2c51424a33a1%40continuum.io.
For more options, visit https://groups.google.com/a/continuum.io/d/optout.
Fabio Annovazzi
tel. 0041 (0)78-6334750
www.logeeka.com
Yeah, as is, there is an issue because I didn’t expect to have a dataset with fewer than 2 continuous columns. Here is the in-work pull request that addresses the issue and adds some more functionality:
https://github.com/bokeh/bokeh/pull/2100
On Tue, Mar 24, 2015 at 4:14 PM, Fabio Annovazzi [email protected] wrote:
Hi Nick,
Again thanks for the great work! Bokeh crossfilter is realy cool!
Converting the Year to str did not work for me I think because I only have another numeric field, Rating.
So if I convert Year to string it returns me an error when it loads the chart (see below) since the dashboard initially loads as a scatter that needs two numerical fields. Or at least that is what I think happens.
File “C:\Users\fabio\Anaconda\lib\site-packages\bokeh\crossfilter\models.py”, line 283, in make_plot_choices
x, y = [x['name'] for x in self.continuous_columns()[:2]]
ValueError: need more than 1 value to unpack
Best regards
Fabio
–
You received this message because you are subscribed to the Google Groups “Bokeh Discussion - Public” group.
To unsubscribe from this group and stop receiving emails from it, send an email to [email protected].
To post to this group, send email to [email protected].
To view this discussion on the web visit https://groups.google.com/a/continuum.io/d/msgid/bokeh/CACWJ9e%2BnvQjTu1g_2WnkVHFQq7EqG0odk5wMEe5LhpbtdjeRKQ%40mail.gmail.com.
For more options, visit https://groups.google.com/a/continuum.io/d/optout.
Fabio Annovazzi
tel. 0041 (0)78-6334750
www.logeeka.com
On Tue, Mar 24, 2015 at 9:49 PM, Nick Roth [email protected] wrote:
I went back and played with crossfilter a bit and found the issue you are having is primarily due to your classification of your columns. The year is not a traditional numerical/continuous data type, which is how it is treated as an integer. If you make it a string, then it will be treated as discrete data and the bars will be lined up correctly. The reason they aren’t lined up is because the bar plot sees it as continuous data that should be converted to N discrete bins.
Something I’d like to do is gracefully interpret columns. For example, I could look at a column with a small number of integers and know that this is likely categorical/discrete data. it ends up being fairly difficult to do this in a way that can handle all possible conditions. One simple fix would be to avoid the binning of continuous data if there are fewer bins than I’m looking for.
I did find some things I wanted to fix with the bar chart, but for the referenced case of mis-alignment, that is a pre-processing issue for now. I’ll create a pull request for those changes here soon.
On Thursday, March 19, 2015 at 5:30:45 AM UTC-5, Fabio Annovazzi wrote:
Thanks Saray and Brian,
it worked fine. Great!. Very minor issues, for instance for some reason it leaves a bigger gap in the bar chart between two years.
There is no way to “preset” the crossfilter to a particular views, isn’t there? I would like to to load with bars instead of scatter, and with a different set of metrics on the X and Y axis…
Great work!
Fabio
On Wednesday, March 18, 2015 at 9:30:08 PM UTC+1, Sarah Bird wrote:
I was just doing this, this morning, in fact and noticed that when I just dumped all my data in, it didn’t like blank cells. I didn’t have time to check out whether this is the CrossFilter or I just need to use a fillna.
In case you’re wondering what the magical autompg is, it’s just a pandas data frame.
Here’s my code:
201 data = pd.read_csv(‘/path/to/my_csv.csv’)
202 data[‘Scenario’] = data[‘Scenario’].astype(str)
203 data[‘Province’] = data[‘Province’].astype(str)
204 app = CrossFilter.create(df=data)Once I’d cleaned up my csv so it was completely full, it worked straight out of the box (although the bar chart doesn’t like negative numbers)
On Wednesday, March 18, 2015 at 1:24:05 PM UTC-7, Bryan Van de ven wrote:
Not a dumb question at all! If you look at the crossfilter_app.py file:
[https://github.com/bokeh/bokeh/blob/master/examples/app/crossfilter/crossfilter_app.py](https://github.com/bokeh/bokeh/blob/master/examples/app/crossfilter/crossfilter_app.py)You can see this is all it does:
    @bokeh_app.route("/bokeh/crossfilter/")

    @object_page("crossfilter")

    def make_crossfilter():

                autompg['cyl'] = autompg['cyl'].astype(str)

                autompg['origin'] = autompg['origin'].astype(str)

                app = CrossFilter.create(df=autompg)

                return app
And that’s really all you need to do too. Copy this script to a new one that passes in whatever Pandas DataFrame is is that you want to look at (with categorical columns converted to strings for now) instead of the “autompg” data. Then call bokeh-server with this new script for the --script argument. It would probably be good to add some kind of flexibility into the crossfilter as it is, to be able to specify a new data frame from the command line or similar. If you ever feel like taking a stab at improvements like that, a pull request would be very welcomed!
Thanks,
Bryan
On Mar 18, 2015, at 3:10 PM, Fabio Annovazzi [email protected] wrote:
I managed to install the crossfilter example and it is absolutely amazing.
I guess this is a stupid question…
Now how do I personalize it with my data?
Thanks so much!
Fabio
–
You received this message because you are subscribed to the Google Groups “Bokeh Discussion - Public” group.To unsubscribe from this group and stop receiving emails from it, send an email to [email protected].
To post to this group, send email to [email protected].
To view this discussion on the web visit https://groups.google.com/a/continuum.io/d/msgid/bokeh/739ed1d4-49b8-4337-9b50-05ddab04b524%40continuum.io.
For more options, visit https://groups.google.com/a/continuum.io/d/optout.
–
You received this message because you are subscribed to the Google Groups “Bokeh Discussion - Public” group.
To unsubscribe from this group and stop receiving emails from it, send an email to [email protected].
To post to this group, send email to [email protected].
To view this discussion on the web visit https://groups.google.com/a/continuum.io/d/msgid/bokeh/39e4bac7-3348-4d4f-9652-2c51424a33a1%40continuum.io.
For more options, visit https://groups.google.com/a/continuum.io/d/optout.
Amazing Nick, really amazing. This tools makes it possible to set up cool dashboards in no time.
BTW have you already thought of making it possible to have somewhat “transparent” dots in the scatter plot, so one, when scatter plots are “crouded”, one has an idea of the concentration of scatter plots in the different areas of the plot?
Thanks again,
Fabio
On Tue, Mar 24, 2015 at 11:12 PM, Nick Roth [email protected] wrote:
Yeah, as is, there is an issue because I didn’t expect to have a dataset with fewer than 2 continuous columns. Here is the in-work pull request that addresses the issue and adds some more functionality:
–
You received this message because you are subscribed to the Google Groups “Bokeh Discussion - Public” group.
To unsubscribe from this group and stop receiving emails from it, send an email to [email protected].
To post to this group, send email to [email protected].
To view this discussion on the web visit https://groups.google.com/a/continuum.io/d/msgid/bokeh/CACqhitTGNypracT6SoyvOvQSd7hHsqg6WoRiV83E7M-kn1MLqg%40mail.gmail.com.
For more options, visit https://groups.google.com/a/continuum.io/d/optout.
Fabio Annovazzi
tel. 0041 (0)78-6334750
www.logeeka.com
On Tue, Mar 24, 2015 at 4:14 PM, Fabio Annovazzi [email protected] wrote:
Hi Nick,
Again thanks for the great work! Bokeh crossfilter is realy cool!
Converting the Year to str did not work for me I think because I only have another numeric field, Rating.
So if I convert Year to string it returns me an error when it loads the chart (see below) since the dashboard initially loads as a scatter that needs two numerical fields. Or at least that is what I think happens.
File “C:\Users\fabio\Anaconda\lib\site-packages\bokeh\crossfilter\models.py”, line 283, in make_plot_choices
x, y = [x['name'] for x in self.continuous_columns()[:2]]
ValueError: need more than 1 value to unpack
Best regards
Fabio
–
You received this message because you are subscribed to the Google Groups “Bokeh Discussion - Public” group.
To unsubscribe from this group and stop receiving emails from it, send an email to [email protected].
To post to this group, send email to [email protected].
To view this discussion on the web visit https://groups.google.com/a/continuum.io/d/msgid/bokeh/CACWJ9e%2BnvQjTu1g_2WnkVHFQq7EqG0odk5wMEe5LhpbtdjeRKQ%40mail.gmail.com.
For more options, visit https://groups.google.com/a/continuum.io/d/optout.
Fabio Annovazzi
tel. 0041 (0)78-6334750
www.logeeka.com
On Tue, Mar 24, 2015 at 9:49 PM, Nick Roth [email protected] wrote:
I went back and played with crossfilter a bit and found the issue you are having is primarily due to your classification of your columns. The year is not a traditional numerical/continuous data type, which is how it is treated as an integer. If you make it a string, then it will be treated as discrete data and the bars will be lined up correctly. The reason they aren’t lined up is because the bar plot sees it as continuous data that should be converted to N discrete bins.
Something I’d like to do is gracefully interpret columns. For example, I could look at a column with a small number of integers and know that this is likely categorical/discrete data. it ends up being fairly difficult to do this in a way that can handle all possible conditions. One simple fix would be to avoid the binning of continuous data if there are fewer bins than I’m looking for.
I did find some things I wanted to fix with the bar chart, but for the referenced case of mis-alignment, that is a pre-processing issue for now. I’ll create a pull request for those changes here soon.
On Thursday, March 19, 2015 at 5:30:45 AM UTC-5, Fabio Annovazzi wrote:
Thanks Saray and Brian,
it worked fine. Great!. Very minor issues, for instance for some reason it leaves a bigger gap in the bar chart between two years.
There is no way to “preset” the crossfilter to a particular views, isn’t there? I would like to to load with bars instead of scatter, and with a different set of metrics on the X and Y axis…
Great work!
Fabio
On Wednesday, March 18, 2015 at 9:30:08 PM UTC+1, Sarah Bird wrote:
I was just doing this, this morning, in fact and noticed that when I just dumped all my data in, it didn’t like blank cells. I didn’t have time to check out whether this is the CrossFilter or I just need to use a fillna.
In case you’re wondering what the magical autompg is, it’s just a pandas data frame.
Here’s my code:
201 data = pd.read_csv(‘/path/to/my_csv.csv’)
202 data[‘Scenario’] = data[‘Scenario’].astype(str)
203 data[‘Province’] = data[‘Province’].astype(str)
204 app = CrossFilter.create(df=data)Once I’d cleaned up my csv so it was completely full, it worked straight out of the box (although the bar chart doesn’t like negative numbers)
On Wednesday, March 18, 2015 at 1:24:05 PM UTC-7, Bryan Van de ven wrote:
Not a dumb question at all! If you look at the crossfilter_app.py file:
[https://github.com/bokeh/bokeh/blob/master/examples/app/crossfilter/crossfilter_app.py](https://github.com/bokeh/bokeh/blob/master/examples/app/crossfilter/crossfilter_app.py)You can see this is all it does:
    @bokeh_app.route("/bokeh/crossfilter/")

    @object_page("crossfilter")

    def make_crossfilter():

                autompg['cyl'] = autompg['cyl'].astype(str)

                autompg['origin'] = autompg['origin'].astype(str)

                app = CrossFilter.create(df=autompg)

                return app
And that’s really all you need to do too. Copy this script to a new one that passes in whatever Pandas DataFrame is is that you want to look at (with categorical columns converted to strings for now) instead of the “autompg” data. Then call bokeh-server with this new script for the --script argument. It would probably be good to add some kind of flexibility into the crossfilter as it is, to be able to specify a new data frame from the command line or similar. If you ever feel like taking a stab at improvements like that, a pull request would be very welcomed!
Thanks,
Bryan
On Mar 18, 2015, at 3:10 PM, Fabio Annovazzi [email protected] wrote:
I managed to install the crossfilter example and it is absolutely amazing.
I guess this is a stupid question…
Now how do I personalize it with my data?
Thanks so much!
Fabio
–
You received this message because you are subscribed to the Google Groups “Bokeh Discussion - Public” group.To unsubscribe from this group and stop receiving emails from it, send an email to [email protected].
To post to this group, send email to [email protected].
To view this discussion on the web visit https://groups.google.com/a/continuum.io/d/msgid/bokeh/739ed1d4-49b8-4337-9b50-05ddab04b524%40continuum.io.
For more options, visit https://groups.google.com/a/continuum.io/d/optout.
–
You received this message because you are subscribed to the Google Groups “Bokeh Discussion - Public” group.
To unsubscribe from this group and stop receiving emails from it, send an email to [email protected].
To post to this group, send email to [email protected].
To view this discussion on the web visit https://groups.google.com/a/continuum.io/d/msgid/bokeh/39e4bac7-3348-4d4f-9652-2c51424a33a1%40continuum.io.
For more options, visit https://groups.google.com/a/continuum.io/d/optout.
The transparent dots gets into the abstract rendering, which I haven’t used. BTW, I just committed some more changes to the pull request that add the percent aggregation type. I think that this simple implementation, in combination with faceting, would provide you with what you were originally looking for.
On Wed, Mar 25, 2015 at 3:37 AM, Fabio Annovazzi [email protected] wrote:
Amazing Nick, really amazing. This tools makes it possible to set up cool dashboards in no time.
BTW have you already thought of making it possible to have somewhat “transparent” dots in the scatter plot, so one, when scatter plots are “crouded”, one has an idea of the concentration of scatter plots in the different areas of the plot?
Thanks again,
Fabio
–
You received this message because you are subscribed to the Google Groups “Bokeh Discussion - Public” group.
To unsubscribe from this group and stop receiving emails from it, send an email to [email protected].
To post to this group, send email to [email protected].
To view this discussion on the web visit https://groups.google.com/a/continuum.io/d/msgid/bokeh/CACWJ9eKcMPWyOR1SKixaGvnR6OAcRYViDSY9b0nX2OMPw4NtOQ%40mail.gmail.com.
For more options, visit https://groups.google.com/a/continuum.io/d/optout.
Fabio Annovazzi
tel. 0041 (0)78-6334750
www.logeeka.com
On Tue, Mar 24, 2015 at 11:12 PM, Nick Roth [email protected] wrote:
Yeah, as is, there is an issue because I didn’t expect to have a dataset with fewer than 2 continuous columns. Here is the in-work pull request that addresses the issue and adds some more functionality:
–
You received this message because you are subscribed to the Google Groups “Bokeh Discussion - Public” group.
To unsubscribe from this group and stop receiving emails from it, send an email to [email protected].
To post to this group, send email to [email protected].
To view this discussion on the web visit https://groups.google.com/a/continuum.io/d/msgid/bokeh/CACqhitTGNypracT6SoyvOvQSd7hHsqg6WoRiV83E7M-kn1MLqg%40mail.gmail.com.
For more options, visit https://groups.google.com/a/continuum.io/d/optout.
On Tue, Mar 24, 2015 at 4:14 PM, Fabio Annovazzi [email protected] wrote:
Hi Nick,
Again thanks for the great work! Bokeh crossfilter is realy cool!
Converting the Year to str did not work for me I think because I only have another numeric field, Rating.
So if I convert Year to string it returns me an error when it loads the chart (see below) since the dashboard initially loads as a scatter that needs two numerical fields. Or at least that is what I think happens.
File “C:\Users\fabio\Anaconda\lib\site-packages\bokeh\crossfilter\models.py”, line 283, in make_plot_choices
x, y = [x['name'] for x in self.continuous_columns()[:2]]
ValueError: need more than 1 value to unpack
Best regards
Fabio
–
You received this message because you are subscribed to the Google Groups “Bokeh Discussion - Public” group.
To unsubscribe from this group and stop receiving emails from it, send an email to [email protected].
To post to this group, send email to [email protected].
To view this discussion on the web visit https://groups.google.com/a/continuum.io/d/msgid/bokeh/CACWJ9e%2BnvQjTu1g_2WnkVHFQq7EqG0odk5wMEe5LhpbtdjeRKQ%40mail.gmail.com.
For more options, visit https://groups.google.com/a/continuum.io/d/optout.
Fabio Annovazzi
tel. 0041 (0)78-6334750
www.logeeka.com
On Tue, Mar 24, 2015 at 9:49 PM, Nick Roth [email protected] wrote:
I went back and played with crossfilter a bit and found the issue you are having is primarily due to your classification of your columns. The year is not a traditional numerical/continuous data type, which is how it is treated as an integer. If you make it a string, then it will be treated as discrete data and the bars will be lined up correctly. The reason they aren’t lined up is because the bar plot sees it as continuous data that should be converted to N discrete bins.
Something I’d like to do is gracefully interpret columns. For example, I could look at a column with a small number of integers and know that this is likely categorical/discrete data. it ends up being fairly difficult to do this in a way that can handle all possible conditions. One simple fix would be to avoid the binning of continuous data if there are fewer bins than I’m looking for.
I did find some things I wanted to fix with the bar chart, but for the referenced case of mis-alignment, that is a pre-processing issue for now. I’ll create a pull request for those changes here soon.
On Thursday, March 19, 2015 at 5:30:45 AM UTC-5, Fabio Annovazzi wrote:
Thanks Saray and Brian,
it worked fine. Great!. Very minor issues, for instance for some reason it leaves a bigger gap in the bar chart between two years.
There is no way to “preset” the crossfilter to a particular views, isn’t there? I would like to to load with bars instead of scatter, and with a different set of metrics on the X and Y axis…
Great work!
Fabio
On Wednesday, March 18, 2015 at 9:30:08 PM UTC+1, Sarah Bird wrote:
I was just doing this, this morning, in fact and noticed that when I just dumped all my data in, it didn’t like blank cells. I didn’t have time to check out whether this is the CrossFilter or I just need to use a fillna.
In case you’re wondering what the magical autompg is, it’s just a pandas data frame.
Here’s my code:
201 data = pd.read_csv(‘/path/to/my_csv.csv’)
202 data[‘Scenario’] = data[‘Scenario’].astype(str)
203 data[‘Province’] = data[‘Province’].astype(str)
204 app = CrossFilter.create(df=data)Once I’d cleaned up my csv so it was completely full, it worked straight out of the box (although the bar chart doesn’t like negative numbers)
On Wednesday, March 18, 2015 at 1:24:05 PM UTC-7, Bryan Van de ven wrote:
Not a dumb question at all! If you look at the crossfilter_app.py file:
[https://github.com/bokeh/bokeh/blob/master/examples/app/crossfilter/crossfilter_app.py](https://github.com/bokeh/bokeh/blob/master/examples/app/crossfilter/crossfilter_app.py)You can see this is all it does:
    @bokeh_app.route("/bokeh/crossfilter/")

    @object_page("crossfilter")

    def make_crossfilter():

                autompg['cyl'] = autompg['cyl'].astype(str)

                autompg['origin'] = autompg['origin'].astype(str)

                app = CrossFilter.create(df=autompg)

                return app
And that’s really all you need to do too. Copy this script to a new one that passes in whatever Pandas DataFrame is is that you want to look at (with categorical columns converted to strings for now) instead of the “autompg” data. Then call bokeh-server with this new script for the --script argument. It would probably be good to add some kind of flexibility into the crossfilter as it is, to be able to specify a new data frame from the command line or similar. If you ever feel like taking a stab at improvements like that, a pull request would be very welcomed!
Thanks,
Bryan
On Mar 18, 2015, at 3:10 PM, Fabio Annovazzi [email protected] wrote:
I managed to install the crossfilter example and it is absolutely amazing.
I guess this is a stupid question…
Now how do I personalize it with my data?
Thanks so much!
Fabio
–
You received this message because you are subscribed to the Google Groups “Bokeh Discussion - Public” group.To unsubscribe from this group and stop receiving emails from it, send an email to [email protected].
To post to this group, send email to [email protected].
To view this discussion on the web visit https://groups.google.com/a/continuum.io/d/msgid/bokeh/739ed1d4-49b8-4337-9b50-05ddab04b524%40continuum.io.
For more options, visit https://groups.google.com/a/continuum.io/d/optout.
–
You received this message because you are subscribed to the Google Groups “Bokeh Discussion - Public” group.
To unsubscribe from this group and stop receiving emails from it, send an email to [email protected].
To post to this group, send email to [email protected].
To view this discussion on the web visit https://groups.google.com/a/continuum.io/d/msgid/bokeh/39e4bac7-3348-4d4f-9652-2c51424a33a1%40continuum.io.
For more options, visit https://groups.google.com/a/continuum.io/d/optout.
Thanks!
Best regards
Fabio
On Wed, Mar 25, 2015 at 5:33 PM, Nick Roth [email protected] wrote:
The transparent dots gets into the abstract rendering, which I haven’t used. BTW, I just committed some more changes to the pull request that add the percent aggregation type. I think that this simple implementation, in combination with faceting, would provide you with what you were originally looking for.
–
You received this message because you are subscribed to the Google Groups “Bokeh Discussion - Public” group.
To unsubscribe from this group and stop receiving emails from it, send an email to [email protected].
To post to this group, send email to [email protected].
To view this discussion on the web visit https://groups.google.com/a/continuum.io/d/msgid/bokeh/CACqhitRErh_m0AbBi9YNTJ7w02jgBovYnSJzazuvxrRvs43a%2BA%40mail.gmail.com.
For more options, visit https://groups.google.com/a/continuum.io/d/optout.
Fabio Annovazzi
tel. 0041 (0)78-6334750
www.logeeka.com
On Wed, Mar 25, 2015 at 3:37 AM, Fabio Annovazzi [email protected] wrote:
Amazing Nick, really amazing. This tools makes it possible to set up cool dashboards in no time.
BTW have you already thought of making it possible to have somewhat “transparent” dots in the scatter plot, so one, when scatter plots are “crouded”, one has an idea of the concentration of scatter plots in the different areas of the plot?
Thanks again,
Fabio
–
You received this message because you are subscribed to the Google Groups “Bokeh Discussion - Public” group.
To unsubscribe from this group and stop receiving emails from it, send an email to [email protected].
To post to this group, send email to [email protected].
To view this discussion on the web visit https://groups.google.com/a/continuum.io/d/msgid/bokeh/CACWJ9eKcMPWyOR1SKixaGvnR6OAcRYViDSY9b0nX2OMPw4NtOQ%40mail.gmail.com.
For more options, visit https://groups.google.com/a/continuum.io/d/optout.
Fabio Annovazzi
tel. 0041 (0)78-6334750
www.logeeka.com
On Tue, Mar 24, 2015 at 11:12 PM, Nick Roth [email protected] wrote:
Yeah, as is, there is an issue because I didn’t expect to have a dataset with fewer than 2 continuous columns. Here is the in-work pull request that addresses the issue and adds some more functionality:
–
You received this message because you are subscribed to the Google Groups “Bokeh Discussion - Public” group.
To unsubscribe from this group and stop receiving emails from it, send an email to [email protected].
To post to this group, send email to [email protected].
To view this discussion on the web visit https://groups.google.com/a/continuum.io/d/msgid/bokeh/CACqhitTGNypracT6SoyvOvQSd7hHsqg6WoRiV83E7M-kn1MLqg%40mail.gmail.com.
For more options, visit https://groups.google.com/a/continuum.io/d/optout.
On Tue, Mar 24, 2015 at 4:14 PM, Fabio Annovazzi [email protected] wrote:
Hi Nick,
Again thanks for the great work! Bokeh crossfilter is realy cool!
Converting the Year to str did not work for me I think because I only have another numeric field, Rating.
So if I convert Year to string it returns me an error when it loads the chart (see below) since the dashboard initially loads as a scatter that needs two numerical fields. Or at least that is what I think happens.
File “C:\Users\fabio\Anaconda\lib\site-packages\bokeh\crossfilter\models.py”, line 283, in make_plot_choices
x, y = [x['name'] for x in self.continuous_columns()[:2]]
ValueError: need more than 1 value to unpack
Best regards
Fabio
–
You received this message because you are subscribed to the Google Groups “Bokeh Discussion - Public” group.
To unsubscribe from this group and stop receiving emails from it, send an email to [email protected].
To post to this group, send email to [email protected].
To view this discussion on the web visit https://groups.google.com/a/continuum.io/d/msgid/bokeh/CACWJ9e%2BnvQjTu1g_2WnkVHFQq7EqG0odk5wMEe5LhpbtdjeRKQ%40mail.gmail.com.
For more options, visit https://groups.google.com/a/continuum.io/d/optout.
Fabio Annovazzi
tel. 0041 (0)78-6334750
www.logeeka.com
On Tue, Mar 24, 2015 at 9:49 PM, Nick Roth [email protected] wrote:
I went back and played with crossfilter a bit and found the issue you are having is primarily due to your classification of your columns. The year is not a traditional numerical/continuous data type, which is how it is treated as an integer. If you make it a string, then it will be treated as discrete data and the bars will be lined up correctly. The reason they aren’t lined up is because the bar plot sees it as continuous data that should be converted to N discrete bins.
Something I’d like to do is gracefully interpret columns. For example, I could look at a column with a small number of integers and know that this is likely categorical/discrete data. it ends up being fairly difficult to do this in a way that can handle all possible conditions. One simple fix would be to avoid the binning of continuous data if there are fewer bins than I’m looking for.
I did find some things I wanted to fix with the bar chart, but for the referenced case of mis-alignment, that is a pre-processing issue for now. I’ll create a pull request for those changes here soon.
On Thursday, March 19, 2015 at 5:30:45 AM UTC-5, Fabio Annovazzi wrote:
Thanks Saray and Brian,
it worked fine. Great!. Very minor issues, for instance for some reason it leaves a bigger gap in the bar chart between two years.
There is no way to “preset” the crossfilter to a particular views, isn’t there? I would like to to load with bars instead of scatter, and with a different set of metrics on the X and Y axis…
Great work!
Fabio
On Wednesday, March 18, 2015 at 9:30:08 PM UTC+1, Sarah Bird wrote:
I was just doing this, this morning, in fact and noticed that when I just dumped all my data in, it didn’t like blank cells. I didn’t have time to check out whether this is the CrossFilter or I just need to use a fillna.
In case you’re wondering what the magical autompg is, it’s just a pandas data frame.
Here’s my code:
201 data = pd.read_csv(‘/path/to/my_csv.csv’)
202 data[‘Scenario’] = data[‘Scenario’].astype(str)
203 data[‘Province’] = data[‘Province’].astype(str)
204 app = CrossFilter.create(df=data)Once I’d cleaned up my csv so it was completely full, it worked straight out of the box (although the bar chart doesn’t like negative numbers)
On Wednesday, March 18, 2015 at 1:24:05 PM UTC-7, Bryan Van de ven wrote:
Not a dumb question at all! If you look at the crossfilter_app.py file:
[https://github.com/bokeh/bokeh/blob/master/examples/app/crossfilter/crossfilter_app.py](https://github.com/bokeh/bokeh/blob/master/examples/app/crossfilter/crossfilter_app.py)You can see this is all it does:
@bokeh_app.route("/bokeh/crossfilter/") @object_page("crossfilter") def make_crossfilter(): autompg['cyl'] = autompg['cyl'].astype(str) autompg['origin'] = autompg['origin'].astype(str) app = CrossFilter.create(df=autompg) return appAnd that’s really all you need to do too. Copy this script to a new one that passes in whatever Pandas DataFrame is is that you want to look at (with categorical columns converted to strings for now) instead of the “autompg” data. Then call bokeh-server with this new script for the --script argument. It would probably be good to add some kind of flexibility into the crossfilter as it is, to be able to specify a new data frame from the command line or similar. If you ever feel like taking a stab at improvements like that, a pull request would be very welcomed!
Thanks,
Bryan
On Mar 18, 2015, at 3:10 PM, Fabio Annovazzi [email protected] wrote:
I managed to install the crossfilter example and it is absolutely amazing.
I guess this is a stupid question…
Now how do I personalize it with my data?
Thanks so much!
Fabio
–
You received this message because you are subscribed to the Google Groups “Bokeh Discussion - Public” group.To unsubscribe from this group and stop receiving emails from it, send an email to [email protected].
To post to this group, send email to [email protected].
To view this discussion on the web visit https://groups.google.com/a/continuum.io/d/msgid/bokeh/739ed1d4-49b8-4337-9b50-05ddab04b524%40continuum.io.
For more options, visit https://groups.google.com/a/continuum.io/d/optout.
–
You received this message because you are subscribed to the Google Groups “Bokeh Discussion - Public” group.
To unsubscribe from this group and stop receiving emails from it, send an email to [email protected].
To post to this group, send email to [email protected].
To view this discussion on the web visit https://groups.google.com/a/continuum.io/d/msgid/bokeh/39e4bac7-3348-4d4f-9652-2c51424a33a1%40continuum.io.
For more options, visit https://groups.google.com/a/continuum.io/d/optout.