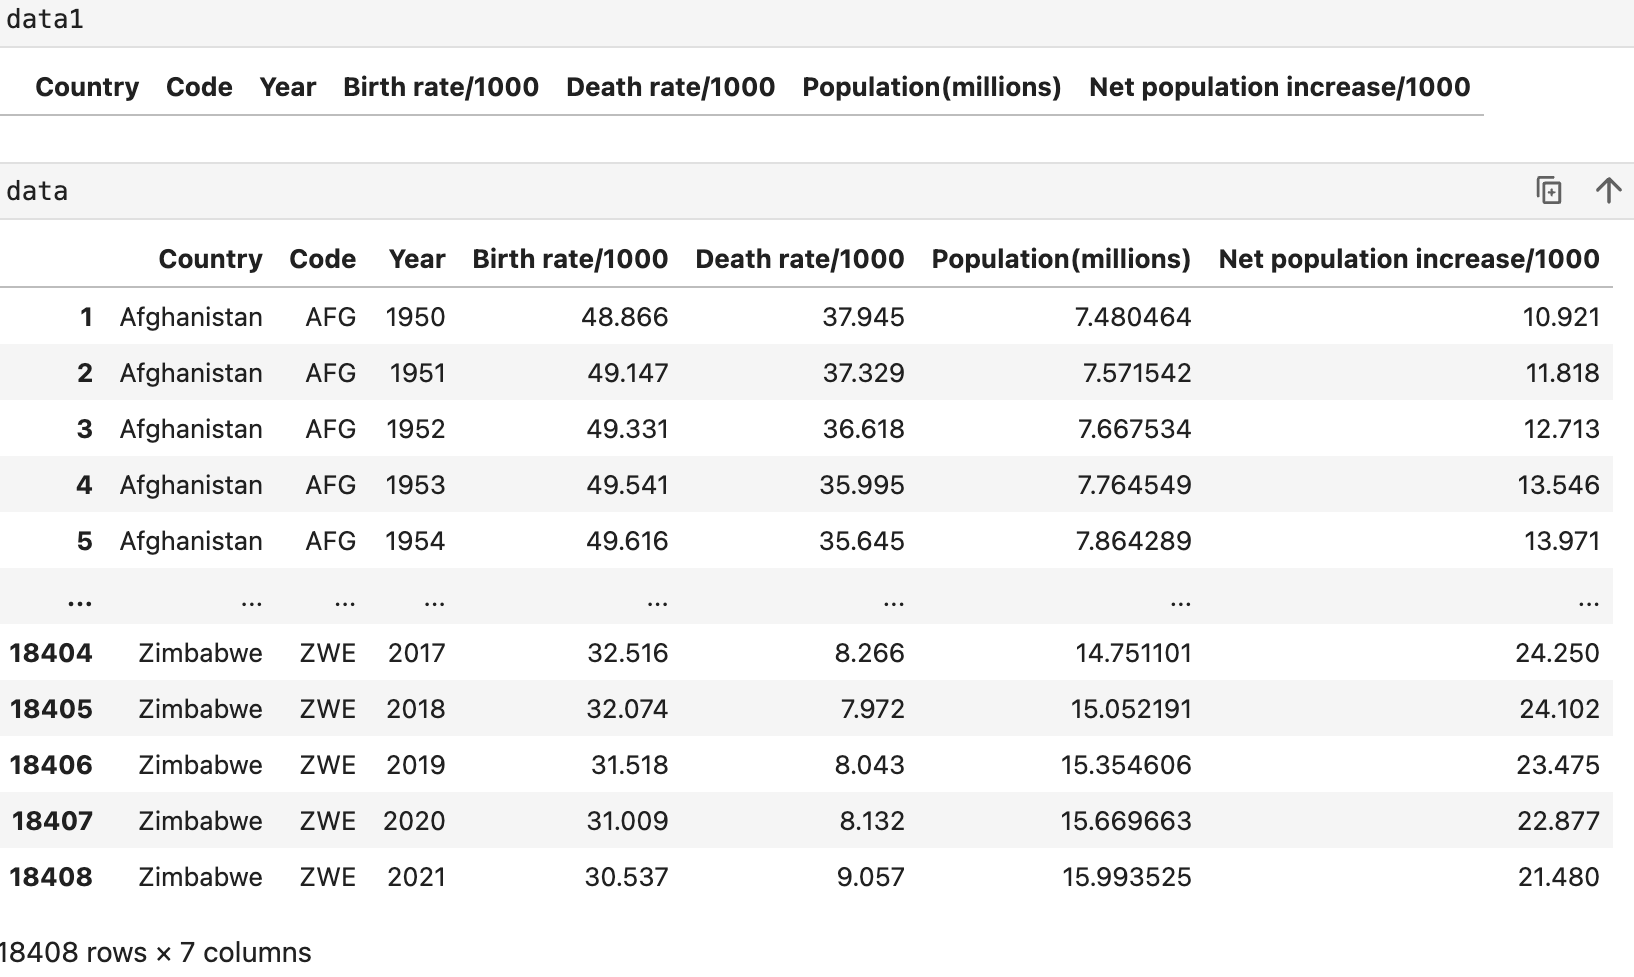
Hello everyone, I’m trying to get particular values from “data” and add specific values onto “data1” data frame using my callback function. I then plan on using this as the data source for another call back function which will do the actual plotting. However I’m not sure whether I have the JS syntax correct or not, would appreciate it if someone could help me out.
callbackrs = CustomJS(args={'data_source': data_source, 'data_source_1': data_source_1}, code="""
    new_data_obj = data_source.data
    var year_range = cb_obj.value
    var data = data_source.data
    var data1 = data_source_1.data

    var target_column = data['Year']
    const year_length = data['Year'].length
    for (let i = 0; i < year_length; i++) {
        if (target_column[i] <= year_range[1] and target_column[i] >= year_range[1]) {
        /* only add data if specific condition is satified */

        /* Adding values from data (big data frame) to data1 temporary data frame used for input for
        another call back function so that values can be updated dynamically via range slider*/

        /* Here i'm trying to add the value for 'Country' on the i-th row of the big data frame
            data1['Country'] += data['Country'][i]
            data1['Year'] += target_column[i]
            data1['Birth rate/1000'] += data['Birth rate/1000'][i]
            data1['Death rate/1000'] += data['Death rate/1000'][i]
            data1['Population(millions)'] += data['Population(millions)'][i]
            data1['Net population increase/1000'] += data['Net population increase/1000'][i]
        }
    }
""")
# Define parameters for range slider
range_slider = RangeSlider(title='Year', start=1950, end=2021, step=1, value=(1950, 2021))
In this case I’m just trying to add one value at a time but I’m open to suggestions on whether there’s anyways to push an entire row of data into “data1” if thats possible since that would most likely be more convenient.