If you are using cover tools, my recommendation is to always make your own ColumnDataSources, so that you know and control exactly what the column names are. Bokeh will *always* use a CDS, but if you don't provide one yourself (like the example below) then Bokeh makes one, with some default column names depending on the glyph fields (e.g. "x", "radius", etc).
If the data are all the same length, it's possible to drive multiple glyphs for a single CDS, in which case you can just make a single hover tool with whatever columns you want, from that one CDS. That's another good reason to create your own CDS explicitly.
If the glyphs have different data lengths then you will have to make separate CDS for them. All columns in a given CDS must alway be the *same length* at all times (think of them like cheap Pandas DataFrames). In this case you will need to make multiple hover tools. By default hover tools try to hover for every glyph, but you can restrict different hover tools to different glyphs by using the .renderers property on the tool.
Thanks,
Bryan
···
On Dec 5, 2017, at 03:02, albert_Chan_@126.com wrote:
Hi,
I am new to Bokeh. The doc shows I should do something like this to create a tooltip.
I already have a HoverTool setup for the line plot in the above image, but I’d also like to have one for the vertical Span which uses a different data set.
Ah. I suspected as much. Thank you for confirming.
What if I overlaid some lines where the spans are. How could I attach a separate CDS to them (separate from the trend line)?
For the little more context, the horizontal trend line has my test data, and the vertical lines has annotations. I already have tooltips on on the test data points giving more information about each point, but I’d like the vertical lines to show their annootations when hovered over.
See the following link for one way to add a hover tooltip that is associated with your span. Its conceptually similar to your thought about adding a line. Either should work depending on the mode you choose for activating. I think regardless you’d want to set the alphas (transparency properties) for that added glyph to 0.0 so it is not visible from the user’s perspective.
Regarding the second part of the question, have you tried generating two separate hover tools and associating the first one with the trendline and the second with the vertical line/span. The HoverTool has a renderers property where you can list specific glyphs that you want to be associated with it rather than all glyphs on the plot.
The column data sources are not properties of the figure but rather the glyphs rendered in the figure.
I looked at the code snippet you provided, and it looks very well-written but in the interest of time, I chose to assemble a very small example of how to accomplish your goal so you can extend and integrate as it best fits into your larger application.
Here’s an illustrative example of adding hover tools that are effectively associated with the spans, and separate column data sources attached to populate with information of interest.
#!/usr/bin/env python3
# -*- coding: utf-8 -*-
"""
"""
from bokeh.plotting import figure, show
from bokeh.models import ColumnDataSource, Span, HoverTool


p = figure(width=400, height=300, x_range=(0.0,1.0), y_range=(0.0,1.0))
p.line(x=[0.0,1.0], y=[0.5,0.5])

# Spans
data = dict(x=[1./3.,2./3.], ev=['Something interesting happened here...','Here too...'])
source = ColumnDataSource(data=data)

S = [Span(location=x, dimension='height', line_color='#ff0000', line_alpha=0.2) for x in data['x']]
_ = [p.add_layout(s) for s in S]

# Hover tool support for spans
r = p.circle(x='x', y=0.5, source=source, size=30, alpha=0.0)

h = HoverTool(renderers=[r], tooltips=({'x': '@x', 'Event': '@ev'}), mode='vline')
p.add_tools(h)

show(p)
@_jm
This was exactly what I was looking for. Thanks so much for pointing me in the right direction (and the detailed example).
I had to collect my previous renderers for the line plots so that the previous hovertool I created wasn’t general to the figure, but specific to the line/scatter renderers. (In case anyone else runs into my situation.)
@_jm
Hey, sorry for bringing up an old thread, but I noticed recently that the workaround I implemented from above breaks when the plot is zoomed since the x/y values of the hidden glyphs (circles) don’t seem to be updated for their hovertool. Is there a way to have the hovertool update it’s x/y values for the associated renderers?
Some clarification. If I zoom the graph in such a way that the dummy glyph to which the hovertools are associated (the circles in this case) are no longer in the graph, then the hovertool no longer activates despite the hovertool specifying “vline” mode.
I also tried using segments as the dummy glyph and ran into a similar issue with the tooltip only showing at a certain y-value.
I am not certain I understand the issue entirely without a simple, runnable example to inspect and perhaps images illustrating the issue, e.g. where you’re zoomed in and what you see versus what your expect.
With that disclaimer, the vline mode of the HoverTool will trigger the hover whenever your mouse is at the same x-coordinate of the associated glyph, i.e. a vertical line intersects the mouse pointer location and the centroid of the glyph. So it would be instructive to know where the glyph is placed, where the mouse is, etc.
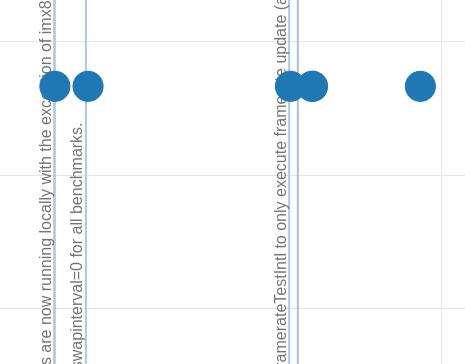
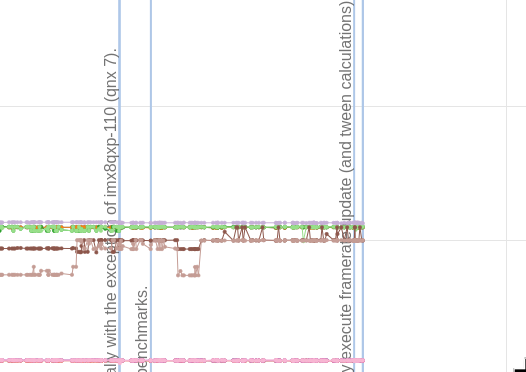
I “unhid” the dummy glyphs I’m using to anchor my hovertools for the spans to illustrate the issue. When I hover over the span, I get the tooltip as expected. However, if I zoom or pan the graph in such a way that the dummy glyphs are no longer rendered, then the tooltips no longer display. I know that this possibly intended behaviour for the tooltips, but I need another way to workaround the fact that we can’t add a tooltip to a span then.
Perhaps something like the following can be adapted to your use-case. This illustrative example uses a scalar y-value for the circle glyphs to put them at the same level. And a client-side JavaScript property link is used to automatically move the glyphs to the max (or min) — your choice — when the axes limits change b/c of panning, zooming, or whatever.
You could of course write other JavaScript callbacks or Python callbacks in a server context if you wanted other behaviors beyond what is possible via a simple property linkage.
#!/usr/bin/env python3
# -*- coding: utf-8 -*-
"""
"""
import numpy as np

from bokeh.models import ColumnDataSource
from bokeh.plotting import figure
from bokeh.io import show

n = 10
data = dict(x=np.linspace(0.0,10.0,n))
source = ColumnDataSource(data=data)

p = figure(width=400, height=300)
r = p.circle(x='x', y=0.5, source=source, size=10)

# Client-side JavaScript link to reposition circle glyph to min/max y-axis value
# which automatically  updates when range changes via  pan, zoom, etc.
#p.y_range.js_link('start', r.glyph, 'y')
p.y_range.js_link('end', r.glyph, 'y')

show(p)
Exactly what I was looking for. Thanks so much for your detailed response. I really appreciate the help.
Is there any particular section of the docs that you would recommend reading for better understanding adding JS callbacks? For example, in trying to solve the above issue, I wanted to look for a way to update the y position of the circles I created exactly like how you did by searching for “bokeh circles” which lead me to the https://docs.bokeh.org/en/latest/docs/reference/models/markers/circle.html page, but couldn’t really piece together a solution from the docs there. (I thought js_event_callbacks looked promising but couldn’t really piece it together.)
The User’s Guide has a “Making Interactions” section, and a subheading therein is the callbacks documentation. See here.
The Bokeh reference manual’s section on models also has some details on the js_link method to tie together properties of two models via a high-level interface. See here.
I think ultimately whether you use a more-general JS callback or property link really depends on the application and interaction requirements of the specific problem being addressed.

 )
)