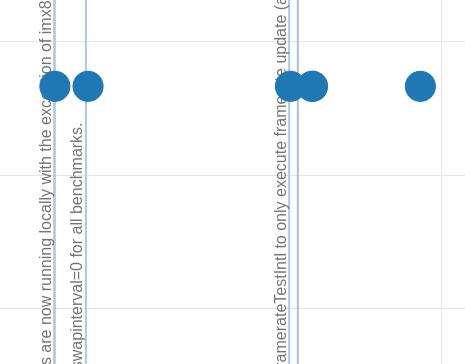
I “unhid” the dummy glyphs I’m using to anchor my hovertools for the spans to illustrate the issue. When I hover over the span, I get the tooltip as expected. However, if I zoom or pan the graph in such a way that the dummy glyphs are no longer rendered, then the tooltips no longer display. I know that this possibly intended behaviour for the tooltips, but I need another way to workaround the fact that we can’t add a tooltip to a span then.
(For example, if I pan up like so: 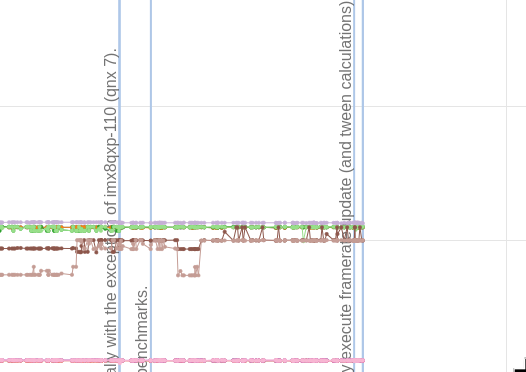 )
)