Hello everybody,
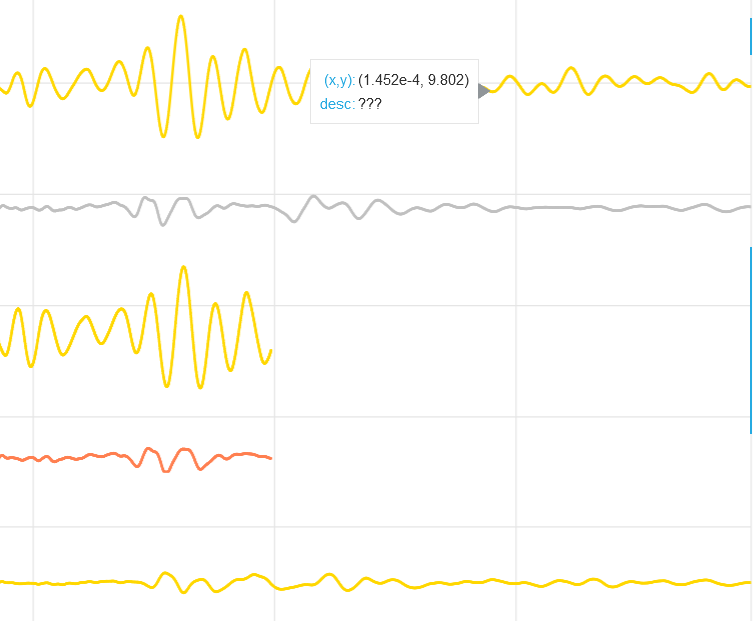
I have multiple data files that each contain x and y. I’ve tried to plot these files on the same figure but they would be overlapping due to proximity of y values between these files. Thus, I’ve created a new column for each of the data files to cascade the y values. Then I would plot the x, and the cascaded y-values to offset individual charts instead of overlapping them.
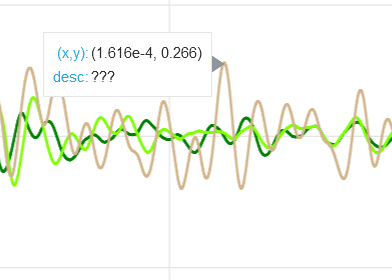
This would result in an incorrect y-value for each file; which is acceptable. However, I want to show the original y-value before offsetting using hovertool. I tried my hands to at it; alas, it’s not working.
from bokeh.layouts import layout
from bokeh.models import ColorPicker, RangeSlider,HoverTool
from bokeh.plotting import Figure, output_file, show

TOOLTIPS = [
    ("t", "$x"),
    ("A", "@A"),
]

p = Figure(
    x_range=(dfs[0]['t'].min(), dfs[0]['t'].max()),
              x_axis_label = "t (ns)",
              y_axis_label = "mV",
              plot_width=850,
              plot_height=600

)
for i in range(0,menu):
    line = p.line(x='t',legend_label=file_names[i],
                 y='cascade',
                 color=random.choice(color),
                source = source[i],
                 line_width=2)
    hover_tool = HoverTool(tooltips=TOOLTIPS)
    hover_tool.mode = 'mouse'
    p.add_tools(hover_tool)
    p.legend.location = "top_left"
    p.legend.click_policy="hide"

    output_file("test.html", title="test")


    range_slider = RangeSlider(
        title=" Adjust X-Axis range",
        start=0,
        end=dfs[0]['t'].max(),
        step=1e-5,
        value=(p.x_range.start, p.x_range.end),
    )
    range_slider.format = "0.000000"
    range_slider.js_link("value", p.x_range, "start", attr_selector=0)
    range_slider.js_link("value", p.x_range, "end", attr_selector=1)


    ##Final Chart layout
layout = layout([
            [range_slider],
            [p]])


show(layout)
I’m getting the following error:
RuntimeError: Models must be owned by only a single document, ColumnDataSource(id='1002', ...) is already in a doc