How to add range tool to common-axis multichart

I can add a range tool to one chart like the example range_tool.py (range_tool.py — Bokeh 2.4.2 Documentation)
But when I create common-x-axis multichart first, and then want to add range tool to them, I don’t know how to set RangeTool(x_range=???)
Below is my code

from bokeh.io import show
from bokeh.models import ColumnDataSource, RangeTool,DataRange1d
from bokeh.plotting import figure
from bokeh.layouts import gridplot

x =  [1,2,3,4,5,6,7,8,9,10]
y1 = [4,5,6,4,8,9,5,6,4,5]
y2 = [3,5,6,8,7,5,9,2,4,5]

source = ColumnDataSource(data=dict(x=x, y1=y1, y2=y2))

xdr = DataRange1d(bounds=None)

p1 = figure(plot_height=300, plot_width=800, tools="xpan", toolbar_location=None,
            x_axis_location="above", background_fill_color="#efefef", x_range=xdr)

p1.line('x', 'y1', source=source, legend_label='y1', color="#2874A6")

p2 = figure(plot_height=100, plot_width=800, tools="", toolbar_location=None,
               x_axis_location="above",background_fill_color="#efefef", x_range=xdr)

p2.line('x', 'y2', source=source, legend_label='y2', color="#2874A6")


select = figure(title="Drag the middle and edges of the selection box to change the range above",
                plot_height=130, plot_width=800, y_range=p1.y_range, y_axis_type=None,
                tools="", toolbar_location=None, background_fill_color="#efefef")

range_tool = RangeTool(x_range=None)

select.line('x', 'y1', source=source, color="#2874A6")
select.ygrid.grid_line_color = None
select.add_tools(range_tool)
select.toolbar.active_multi = range_tool

show(gridplot([p1,p2,select], ncols=1))

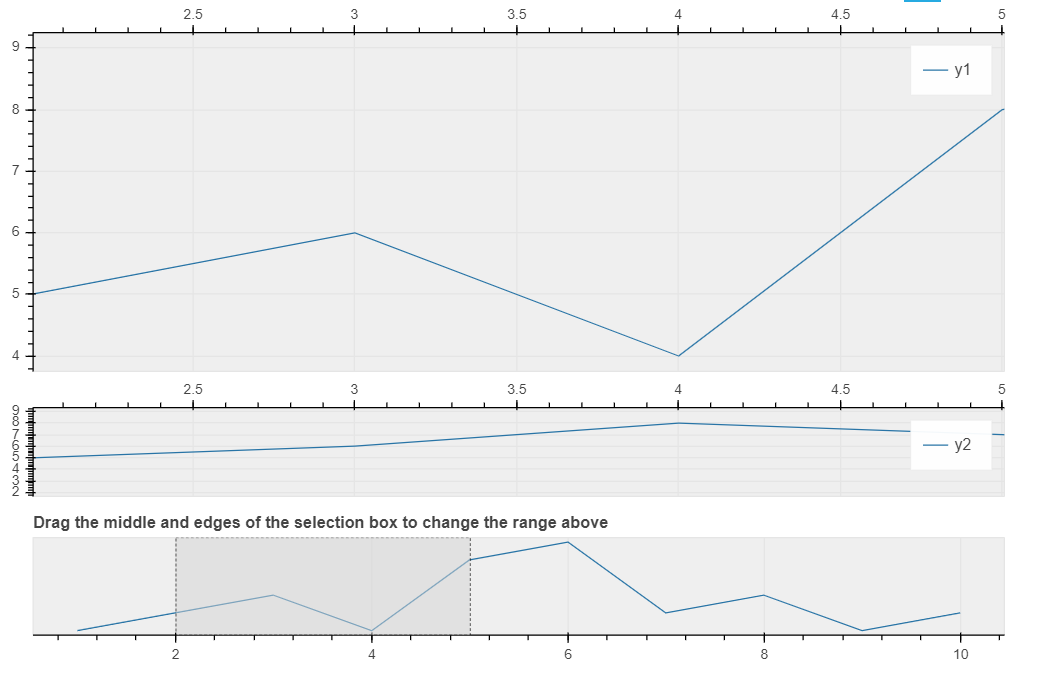
and below is the result

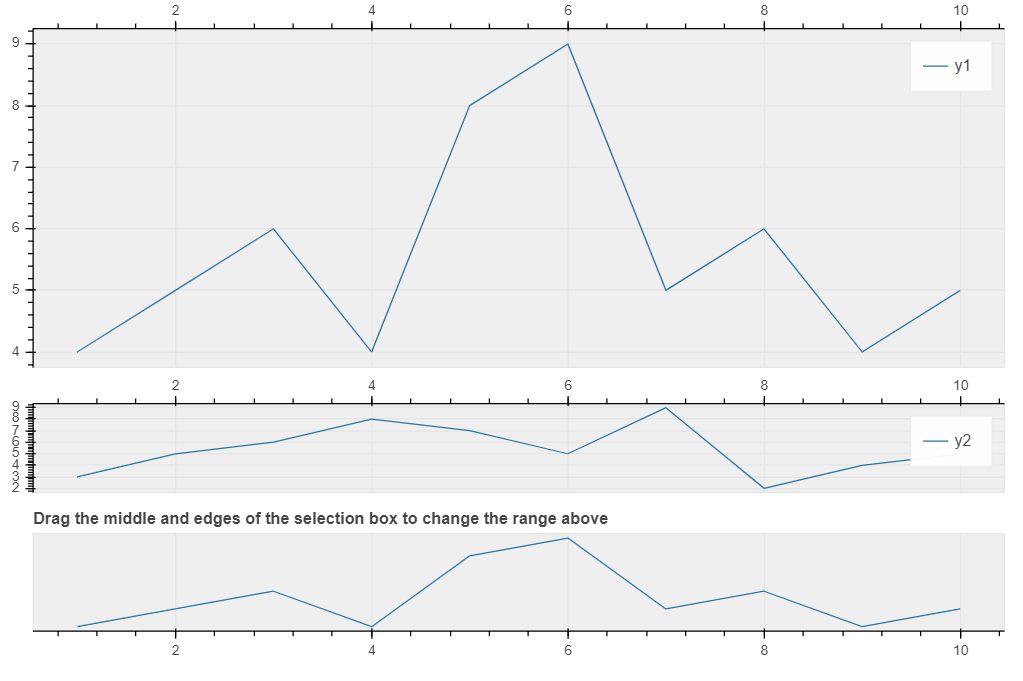
I don’t know how to set RangeTool(x_range= ), so I set None. I don’t know how to resolve it. Anyone can help me? Thanks!

You need to share a range between p1 and p2 and then configure that on the RangeTool, e.g.

RangeTool(x_range=xdr)

However you may not be able to use a DataRange1d for xdr. I think you will have to use a plain (“dumb”) Range1d instead. The whole point of a RangeTool is that the range is manually adjusted by manipulating the widget, i.e. the ranges are not automatic.

It works!! Awesome!
I think I really understand more about those two functions!

and below is my code after fixing:

from bokeh.io import show
from bokeh.models import ColumnDataSource, RangeTool,DataRange1d, Range1d
from bokeh.plotting import figure
from bokeh.layouts import gridplot

x =  [1,2,3,4,5,6,7,8,9,10]
y1 = [4,5,6,4,8,9,5,6,4,5]
y2 = [3,5,6,8,7,5,9,2,4,5]

source = ColumnDataSource(data=dict(x=x, y1=y1, y2=y2))

xdr = Range1d(start=x[2],end=x[5])

p1 = figure(plot_height=300, plot_width=800, tools="xpan", toolbar_location=None,
            x_axis_location="above", background_fill_color="#efefef", x_range=xdr)

p1.line('x', 'y1', source=source, legend_label='y1', color="#2874A6")

p2 = figure(plot_height=100, plot_width=800, tools="", toolbar_location=None,
               x_axis_location="above",background_fill_color="#efefef", x_range=xdr)

p2.line('x', 'y2', source=source, legend_label='y2', color="#2874A6")


select = figure(title="Drag the middle and edges of the selection box to change the range above",
                plot_height=130, plot_width=800, y_range=p1.y_range, y_axis_type=None,
                tools="", toolbar_location=None, background_fill_color="#efefef")

range_tool = RangeTool(x_range=xdr)

select.line('x', 'y1', source=source, color="#2874A6")
select.ygrid.grid_line_color = None
select.add_tools(range_tool)
select.toolbar.active_multi = range_tool

show(gridplot([p1,p2,select], ncols=1))

Below is the chart:

I appreciate your reply and it really help me save lots of time! Thanks!

1 Like

This topic was automatically closed 90 days after the last reply. New replies are no longer allowed.