I would like to add an entry to a legend that represents a span.
I am aware this and related things have been discussed before:
But since all those discussions seem quite old, I wanted to ask again (and did so also on stackoverflow)
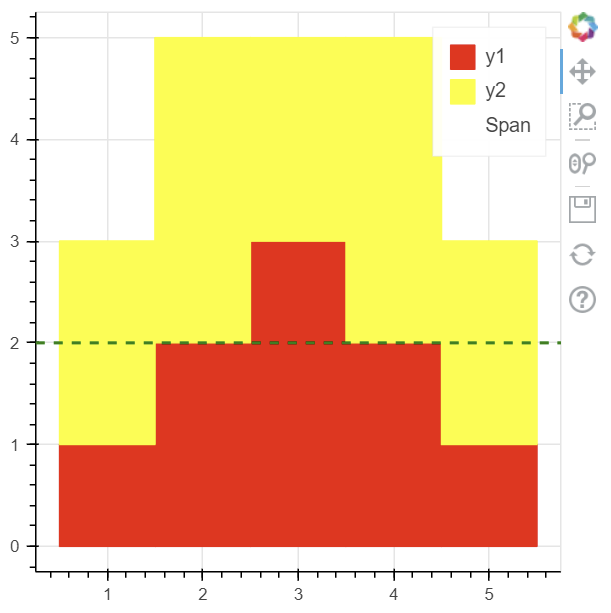
The following approach does not work:
from bokeh.models import ColumnDataSource, Span
from bokeh.plotting import figure, show

data = {'y1': [1, 2, 3, 2, 1],
        'y2': [2, 3, 2, 3, 2],
        'x': [1, 2, 3, 4, 5]}
source = ColumnDataSource(data=data)
colors = ['red', 'yellow']

# Create figure
p = figure(width=400, height=400)

bars = p.vbar_stack(['y1', 'y2'], x='x', source=source, color=colors,
                    legend_label=['y1', 'y2'])

# Add a Span
span = Span(location=2, dimension='width', line_dash='dashed',
             line_color="green", line_width=2)
p.add_layout(span)

# Add a line glyph with no data to represent the Span in the legend
p.line([], [], legend_label='Span', line_dash='dashed', line_color="green", line_width=2)
# This used to be a solution, but does not work anymore with bokeh>=2.4

show(p)  # Show plot
Adding data points to the additonal line makes it show up in the legend, but well, then I have an additional line in the plot. I can set its attribute visible to False, but even then it is still part of the plot. The default zoom will try to keep it in the frame. My frame however changes because I am switching out the x-axis, so that is annoying.
That is also why until now I have avoided to contruct the span itself as a line: I would have to recalculate its position on every axis update.
Can anyone tell me if imitating a span with a regular line is my only option?
This works! Huge thanks to you!
I will actually go with p.x_range.only_visible = True because that seems more elegant when I do not need invisibility otherwise, but you helped me find it.
If you want to claim this solution on stackoverflow, please go ahead. Otherwise I will post it tomorrow…
from bokeh.models import ColumnDataSource, Span
from bokeh.plotting import figure, show
data = {'y1': [1, 2, 3, 2, 1],
'y2': [2, 3, 2, 3, 2],
'x': [1, 2, 3, 4, 5]}
source = ColumnDataSource(data=data)
colors = ['red', 'yellow']
# Create figure
p = figure(width=400, height=400)
bars = p.vbar_stack(['y1', 'y2'], x='x', source=source, color=colors,
legend_label=['y1', 'y2'])
# Add a Span
span = Span(location=2, dimension='width', line_dash='dashed',
line_color="green", line_width=2)
p.add_layout(span)
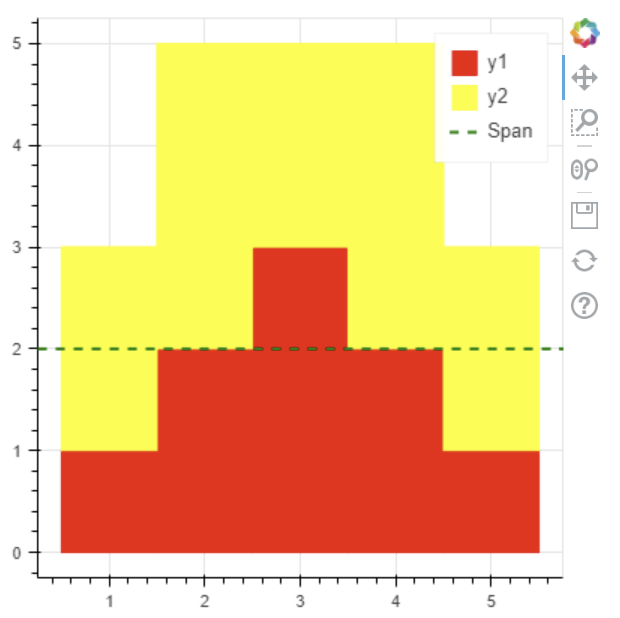
# Add a line glyph with minimal data to represent the Span in the legend
r_line = p.line([0], [0], legend_label='Span', line_dash='dashed',
line_color="green", line_width=2)
r_line.visible = False # Set this fake line to invisible
# The auto-range would still include this invisible object.
# But we have two options to deal with that.
# a) exclude invisible renderers from automatic bounds computations
p.x_range.only_visible = True
p.y_range.only_visible = True
# b) Specifically set the renderers to autorange against
# p.x_range.renderers = bars
# p.y_range.renderers = bars
show(p) # Show plot
Just noting that there is some work ongoing and under consideration that should eventually help here. More or less, eventually moving most everything to be a glyph on the same footing (e.g. legend support) and using the term “annotation” to characterize usage rather than specific subsets of objects.