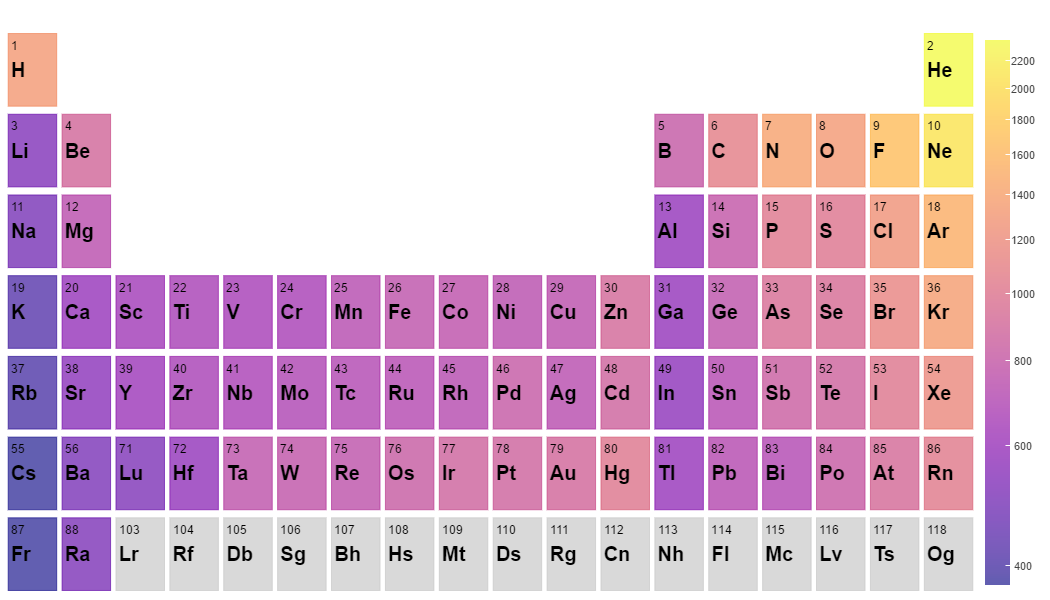
Hello. I am trying to figure out how to add a vertical text label to a vertical color bar. Please refer to my image here (also attached). I know that there is a title command, as mentioned in the documentation. However, if my color bar is vertical, the title is immediately above the bar and written horizontally. I would instead prefer to have the title to be written vertically, to the right of the color bar.
The main reason I want this is because I want to provide units for the values that are plotted. Writing the units horizontally extends the width of the figure too much (or gets cut off if I do not manually extend the width of the figure accordingly). I also think having it written vertically will look a lot better.
An alternate option I’d be interested in is appending text to each one of the numbers on the color bar. For instance, if the values I’m plotting are in kilograms, then I’d like to have each value read “600 kg”, “1000 kg”, etc. instead of just “600” and “1000”. Either solution would be sufficient for my purposes.
Any suggestions would be greatly appreciated!
Hey Andrew,
I’m not sure how to go about changing the text orientation for the major ticks on the color bar. Plot axes have a major_label_orientation attribute that allows for changing the angle of the major tick labels. If there is an equivalent attribute, it doesn’t seem to follow the same naming convention.
Formatting the ColorBar ticks labels is probably the easier solution. The ColorBar model provides a formatter attribute that can be used to format the appearance of tick labels by assigning a new Formatter model. There are some examples and information on tick formatting here. The PrintfTickFormatter should do the trick.
Tyler
···
On Sun, Feb 26, 2017 at 4:58 PM, [email protected] wrote:
Hello. I am trying to figure out how to add a vertical text label to a vertical color bar. Please refer to my image here (also attached). I know that there is a title command, as mentioned in the documentation. However, if my color bar is vertical, the title is immediately above the bar and written horizontally. I would instead prefer to have the title to be written vertically, to the right of the color bar.
The main reason I want this is because I want to provide units for the values that are plotted. Writing the units horizontally extends the width of the figure too much (or gets cut off if I do not manually extend the width of the figure accordingly). I also think having it written vertically will look a lot better.
An alternate option I’d be interested in is appending text to each one of the numbers on the color bar. For instance, if the values I’m plotting are in kilograms, then I’d like to have each value read “600 kg”, “1000 kg”, etc. instead of just “600” and “1000”. Either solution would be sufficient for my purposes.
Any suggestions would be greatly appreciated!
–
You received this message because you are subscribed to the Google Groups “Bokeh Discussion - Public” group.
To unsubscribe from this group and stop receiving emails from it, send an email to [email protected].
To post to this group, send email to [email protected].
To view this discussion on the web visit https://groups.google.com/a/continuum.io/d/msgid/bokeh/8c9883bf-0de6-436f-ad97-271ea2351627%40continuum.io.
For more options, visit https://groups.google.com/a/continuum.io/d/optout.