I like to create rectangle elements in a grid, like in the periodic table.
However some elements have to be connected to others, like edges between nodes in a graph.
periodic table: periodic.py — Bokeh 2.4.1 Documentation
example graph: Visualizing network graphs — Bokeh 2.4.1 Documentation
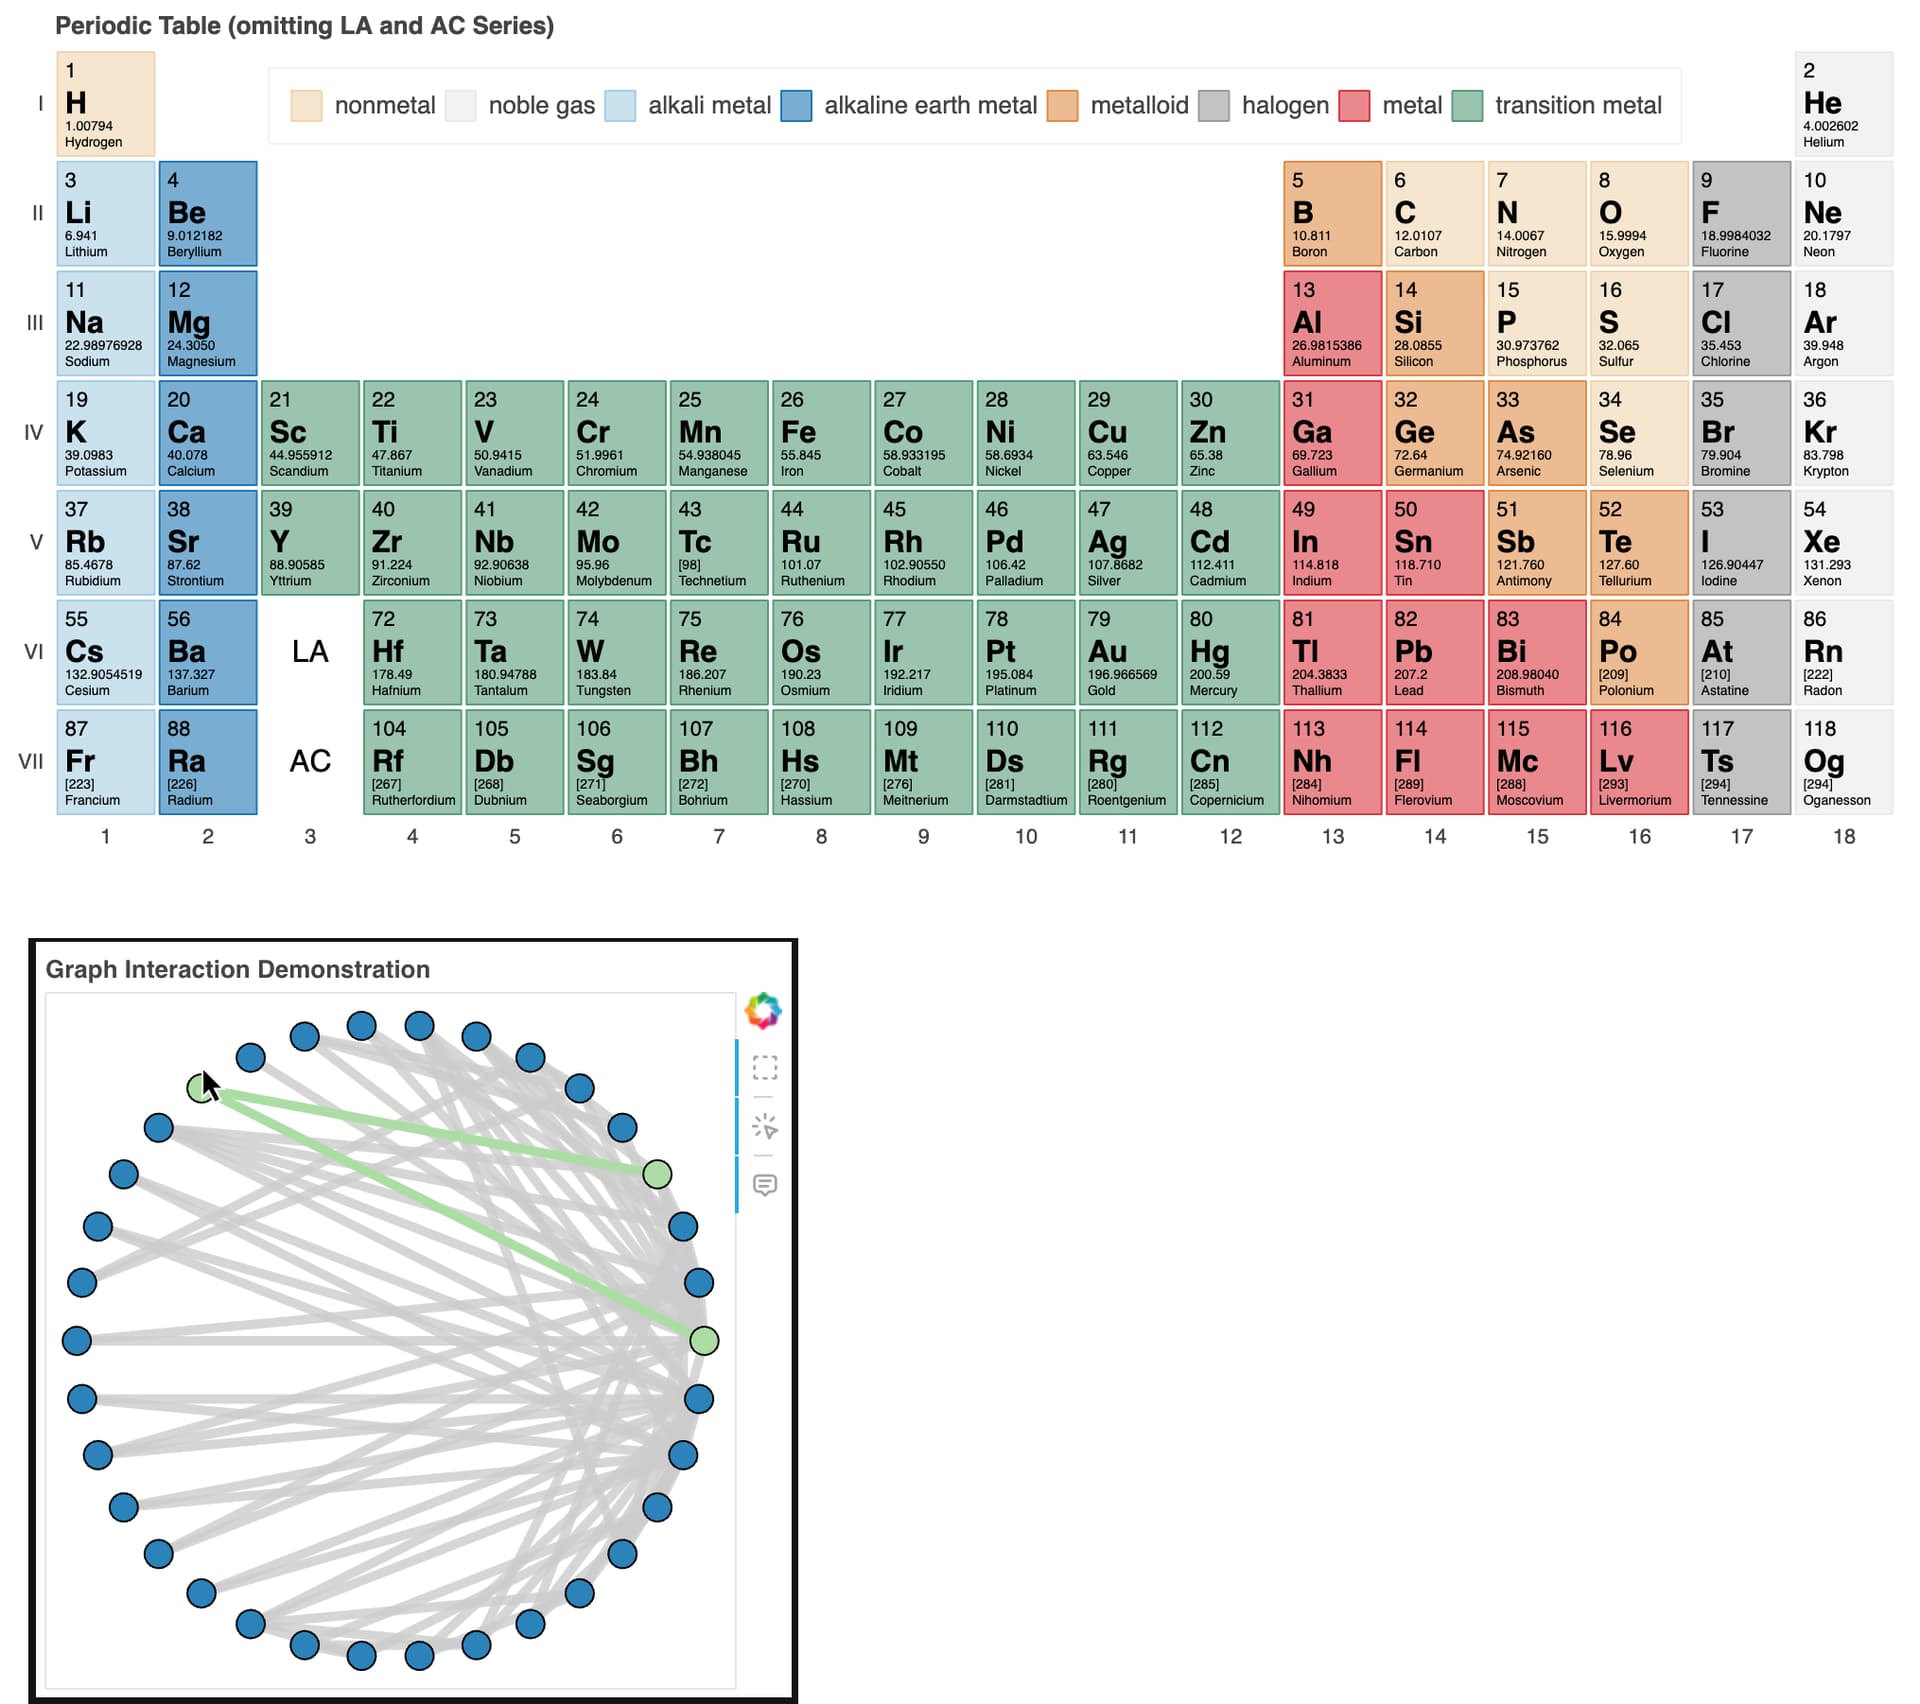
I tried to use networkx in Bokeh for creating a graph. Unfortunately it is not possible to set static positions for the nodes.
This is my current code:
import networkx as nx
from bokeh.io import save, output_file, show
from bokeh.models import Rect, MultiLine, Plot
from bokeh.models import HoverTool
from bokeh.models.graphs import NodesAndLinkedEdges
from bokeh.plotting import from_networkx
# Create Graph with seperate adding edges
G = nx.MultiGraph()
G.add_edge(1, 2)
G.add_edge(2, 3)
G.add_node(4)
# Create Graph with edge_list
G = nx.MultiGraph()
edge_list = [(1,2), (2,3), (2,4), (1,3)]
G.add_edges_from(edge_list)
G.add_nodes_from((5,6,7,8,9,10))
# create plot
plot = Plot(width = 1200,height = 900)
plot.add_tools(HoverTool(tooltips=[("Index", "@index")]))
# create graph with spring_layout
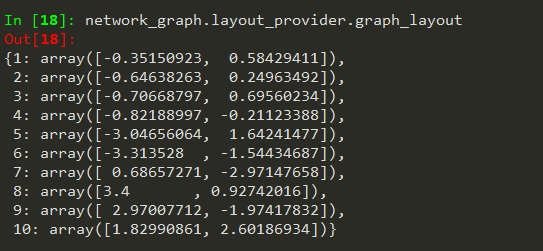
network_graph = from_networkx(G, nx.spring_layout, scale=3.4, center=(0,0))
# nodes
# test with x=10 and y=10, to set custom position
network_graph.node_renderer.glyph = Rect(x=10,y=10,width=0.3, height=0.2, fill_color='skyblue')
network_graph.node_renderer.hover_glyph = Rect(width=0.3, height=0.2, fill_color='navy')
# edges
network_graph.edge_renderer.glyph = MultiLine(line_width=3, line_color="lightgray", line_alpha=1.0)
network_graph.edge_renderer.hover_glyph = MultiLine(line_width=5, line_color="darkblue", line_alpha=1.0)
network_graph.inspection_policy = NodesAndLinkedEdges()
plot.renderers.append(network_graph)
output_file("graph_test.html")
save(plot)
show(plot)
How to set custom position for nodes in a networkx graph, so that they arrange like the elements in the periodic table example?