import pandas as pd
import numpy as np
from bokeh.plotting import figure, show, output_file
from bokeh.tile_providers import CARTODBPOSITRON, get_provider

tile_provider = get_provider(CARTODBPOSITRON)
# range bounds supplied in web mercator coordinates
x_range = [-20*1e5, 60*1e5]
y_range=[-10*1e5, 70*1e5]
p = figure(x_range=x_range, y_range=y_range,
        x_axis_type="mercator", y_axis_type="mercator")
p.add_tile(tile_provider)

p.line(np.array([0, 10, 10, 0, 0])*1e5, np.array([0, 0, 10, 10, 0])*1e5)
output_file("test.html")
show(p)
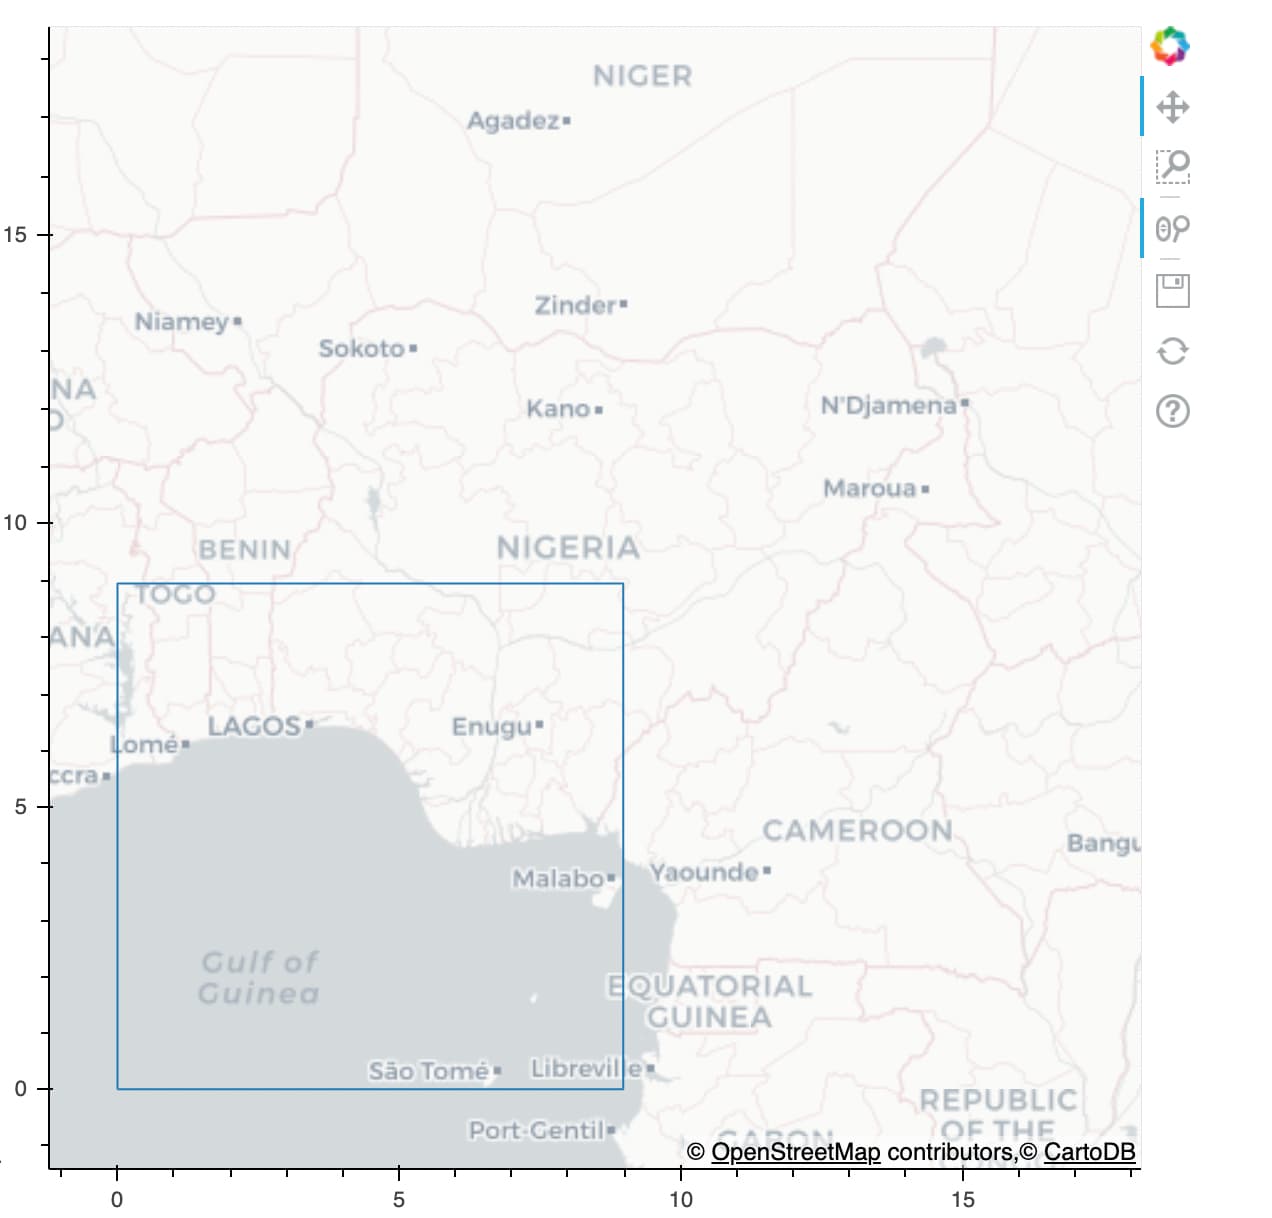
Hello, I am trying to add lines on a figure, it works but the position on the map of the lines is not the same as their coords? Both lat and lon are bigger than the positions’. And the shape formed by the lines is lightly fat than the origin`s. What is the problem? Does the line need a transform ?