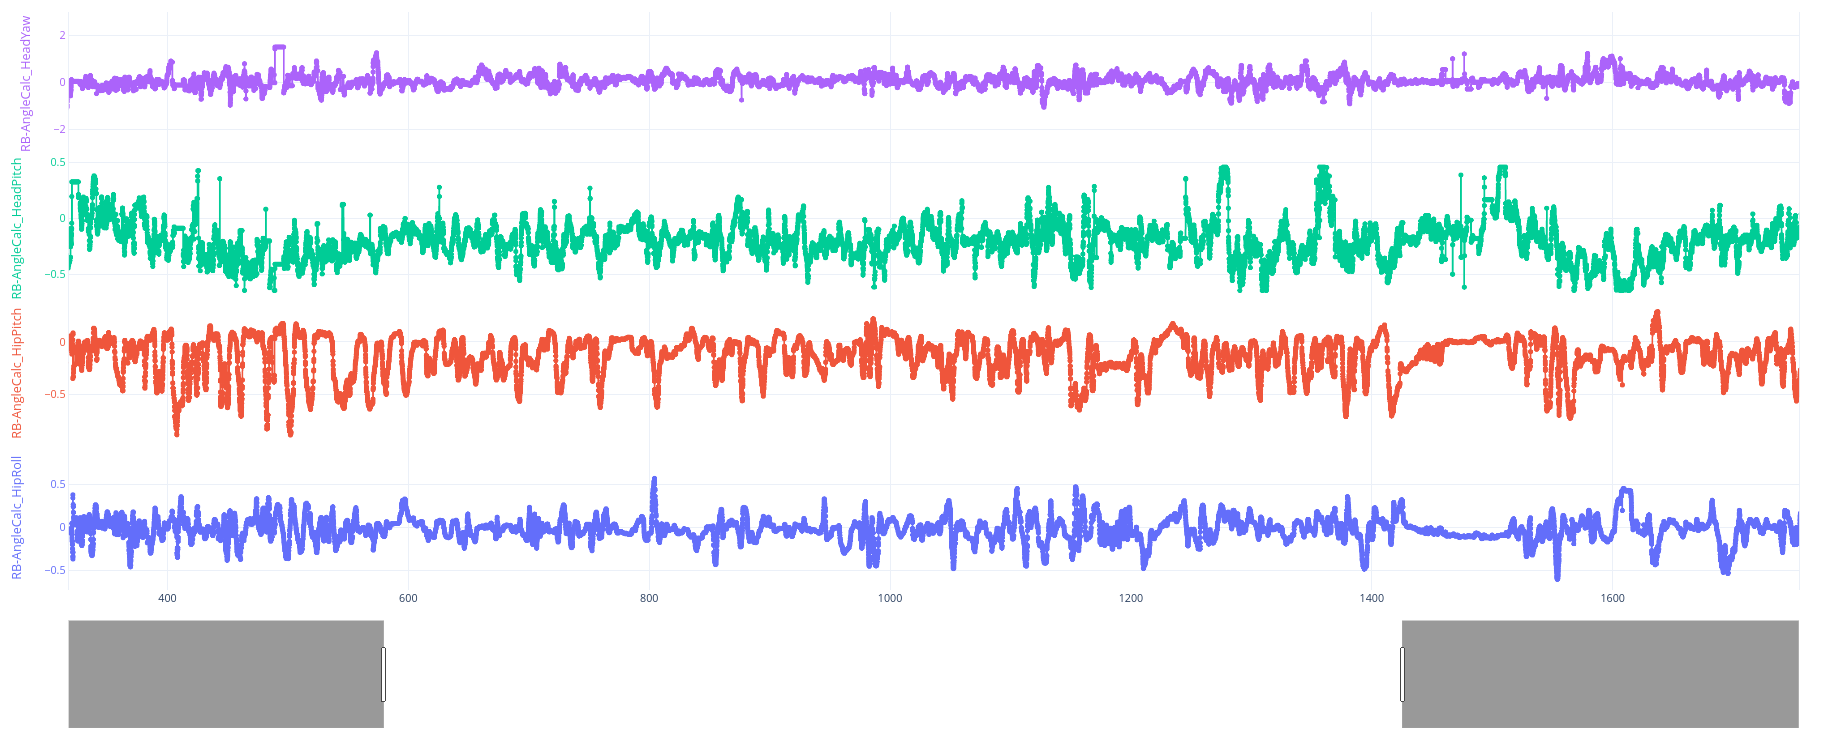
I am considering moving from the Plotly ecosystem to Bokeh/Holoviews but one requirement is that it should be possible to plot several time series in “stacked” view, where all the time series share the x-axis, and a range slider, but have their own y-axis.
Here is an image that illustrates what this looks like:
I would need to be able to have this plot interact with the bokeh/panel server so that a callback gets invoked whenever the plot is scrolled/zoomed or whenever a range is selected.
Hi @johann-petrak linked-ranges are accomplished by sharing range objects between multiple plots, there is a section in the docs dedicated to this topic:
@johann-petrak Sorry, I interpreted “share the x-axis” in the OP to refer to linked axes. You can pass x_axis_location=None to the figure to omit a visible axis. This example may be instructive:
Well, I forgot that example uses the lower level bokeh.models API directly. It still may be instructive, but there are lots of others that set x_axis_location you can grep for.