I would like to plot 3 line charts (1 for each category) against the year. I name the y-axis based on the row names in the data set but it is incorrect. How should I define the naming to pull the data from the dataset?
from bokeh.plotting import figure
from bokeh.io import output_file, output_notebook, show
from bokeh.layouts import column
from bokeh.models import HoverTool, ColumnDataSource

data = pd.read_csv('saving.csv',dtype={'year': object})
data.head()

data['financial_year']=pd.to_datetime(data['financial_year'])

p.line(x= data.financial_year, y = data.rent)
p.line(x= data.financial_year, y = data.entertainment)

show(p)

# create a new plot with a title and axis labels
p = figure(title="Monthly expenditure", x_axis_type='datetime', x_axis_label="financial year", y_axis_label="expenses")

# add a line renderer with legend and line thickness
p.line(x, y, legend_label="expenses", line_width=2)

# Plot date along the x axis and price along the y axis
p.line(data['financial_year'], data['rent'], line_color='green')
p.line(data['financial_year'], data['entertainment'], line_color='blue')

# show the results
show(p)
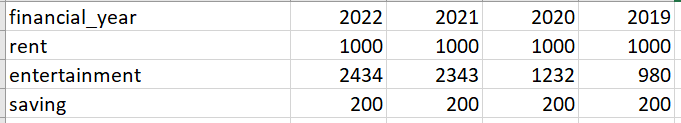
This is a sample of my data set.