Hello there,
Is there a way to set widths of the plots separately within the same column?
I have an issue which is well visible on the plot below. The categorical axis labels on the bottom plot are causing shrinking of the top plot as well. I would like to have top plot span whole available width of the page.
Such behavior is easily reproducible using such a minimal example:
from bokeh.io import output_file, show
from bokeh.layouts import column
from bokeh.plotting import figure
output_file(“layout.html”)
x = list(range(11))
y0 = x
y1 = [10 - i for i in x]
y2 = [abs(i - 5) for i in x]
keys = [“aaaaaaaaaaaaaaa”,
“b”,
“c”,
“d”,
“e”,
“f”,
“g”,
“h”,
“i”,
“j”]
create a new plot
s1 = figure(plot_width=250, plot_height=250, title=None)
s1.circle(x, y0, size=10, color=“navy”, alpha=0.5)
create another one
s2 = figure(plot_width=250, plot_height=250, title=None)
s2.triangle(x, y1, size=10, color=“firebrick”, alpha=0.5)
create and another
s3 = figure(plot_width=250, plot_height=250, title=None, y_range=keys)
s3.square(x, keys, size=10, color=“olive”, alpha=0.5)
put the results in a column and show
show(column(s1, s2, s3))
``
And again for the two top plots there is whole lot of unwanted blank space on the left (as the labels are getting longer):
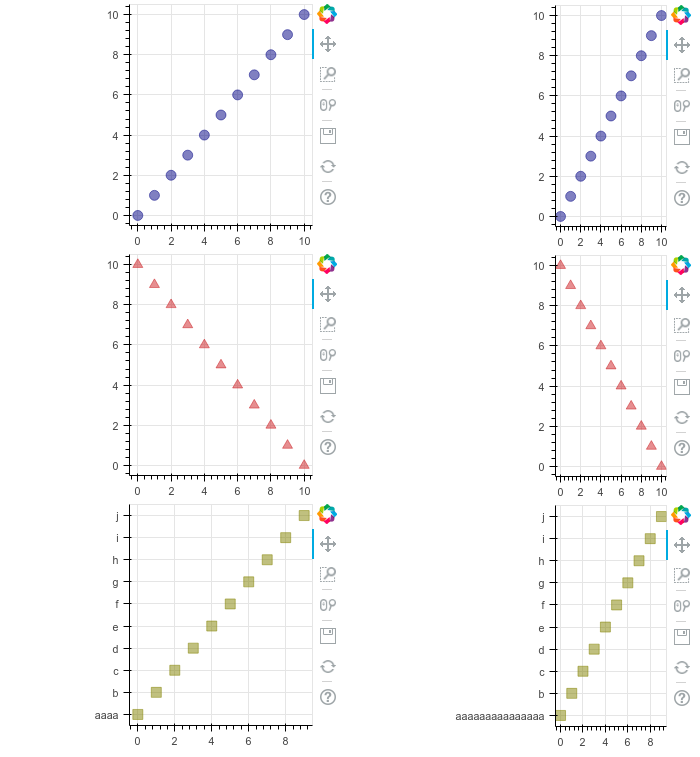
Is there any workaround? Or maybe there is some specific sizing_mode, that I should use with my layout?
Cheers,
Maciej Lewicki