I am using the bokeh to implement an interactive visualization for the MNIST dataset, and the code is attached below. I am writing all the code in Jupyter Notebook following the standard practice on the official website.
from bokeh.plotting import figure, output_file, show
from bokeh.models import CategoricalColorMapper, ColumnDataSource, HoverTool, Column
from bokeh.io import output_notebook, show
from bokeh.plotting import figure
from bokeh import events
output_notebook()

import umap
import numpy as np

from sklearn.datasets import fetch_openml

import matplotlib.pyplot as plt
%matplotlib inline

# Encoding all the images for inclusion in a dataframe.
# reference: https://github.com/lmcinnes/umap/blob/master/doc/bokeh_digits_plot.py
# reference: https://github.com/longubu/itsne/blob/master/itsne/utils/bokeh_utils.py
from io import BytesIO
from PIL import Image
import base64

def embeddable_image(data):
    img_data = 255 - 15 * data.astype(np.uint8)
    image = Image.fromarray(img_data, mode='L').resize((28,28), Image.BICUBIC)
    buffer = BytesIO()
    image.save(buffer, format='png')
    for_encoding = buffer.getvalue()
    return 'data:image/png;base64,' + base64.b64encode(for_encoding).decode()

def convert_to_RGBA(img, alpha=None):
    """Converts input PIL Image or nparray to RGBA. Returns ndarray of shape
    (H, W, 4), where the last channel dimension is `alpha`, the transparency"""
    try:
        if img.mode != "RGBA":
            img = np.array(img.convert("RGBA"))
    except AttributeError:
        img = Image.fromarray(img)
        if img.mode != "RGBA":
            img = np.array(img.convert("RGBA"))
    # reconvert back to npy. we converted ^ to make sure any array is converted
    # to a standard color mode, RGBA, so we can manpipualate easily
    if alpha is not None:
        if alpha >= 0 and alpha <= 255:
            img[:, :, 3] = int(alpha)
        else:
            raise RuntimeError("alpha must be between [0, 255]")

    return np.array(img)

def preproc_img(img, flip_ud=True, alpha=None):
    """ Preprocess a image arr (numpy or PIL.Image) to be absorbed bokeh's
    plotting."""
    # convert to RGBA if it's not, depending on whether ndarr/PIL.Image
    img = convert_to_RGBA(img, alpha=alpha)

    # traditional image conventions refer to top left corner as 0,0.
    # however, bokeh has bottom left (0,0).
    if flip_ud:
        img = np.flipud(img)

    # convert img to be 2d arr (M x N) with dtype = uint32 -- for bokeh
    bimg = np.squeeze(img.astype(np.uint8).view(np.uint32))
    return bimg

"""
Prepare the MNIST data for visualization
"""

mnist = fetch_openml('mnist_784', version=1)
mnist.target = mnist.target.astype(int)

x = mnist.data.loc[:,'pixel1':].values
y = mnist.target.loc[:].values

x_subset = x[0:1000]
y_subset = y[0:1000]

reducer = umap.UMAP(random_state=42)
embedding = reducer.fit_transform(x_subset)

x_subset_reshape = x_subset.reshape(1000,28,28)
imgs = x_subset_reshape  # make sure its numpy array for ease use

# get image shapes to convert to img object for bokeh to absorb
shape = imgs[0].shape
# greyscale
if len(shape) == 2:
    H, W = shape
elif len(shape) == 3:
    H, W, C = shape
else:
    raise RuntimeError("Can't get correct image shape from first"
                       " image of the dataset. Got shape = %s" % shape)
bh, bw = (H / 50, W / 50)
scale = np.max([H, W]) / 5.0
xy = embedding * scale


def bkapp_plot_mnist(doc):
    '''
    bokeh application to plot the MNIST dataset in Jupyter Notebook
    '''

    x = xy[:, 0]
    y = xy[:, 1]

    source = ColumnDataSource(data=(dict(image = [preproc_img(imgs[i], alpha=190) for i in range(0, 1000)],
                                         x = [x[i] - (bw / 2) for i in range(0, 1000)],
                                         y = [y[i] - (bh / 2) for i in range(0, 1000)],
                                         dw = [bw for i in range(0, 1000)],
                                         dh = [bh for i in range(0, 1000)]
    )
    ))

    TOOLTIPS = [
            ("(x,y)", "(@x, @y)"),
        ]

    plot_figure = figure(
        title='UMAP projection of the MNIST dataset',
        plot_width=800,
        plot_height=800,
        tools=('tap, pan, wheel_zoom, reset'),
        tooltips=TOOLTIPS
    )

    plot_figure.image_rgba(source=source, image='image', x='x', y='y', dw='dw', dh='dh', alpha = 0.5)
    plot_figure.circle(
    'x',
    'y',
    source=source,
    line_alpha=0.6,
    fill_alpha=0.6,
    size=4)

    # define the visualizaton layout
    layout = Column(plot_figure)

    doc.add_root(layout)

# show the interactive interface in the Jupyter Notebook
show(bkapp_plot_mnist)
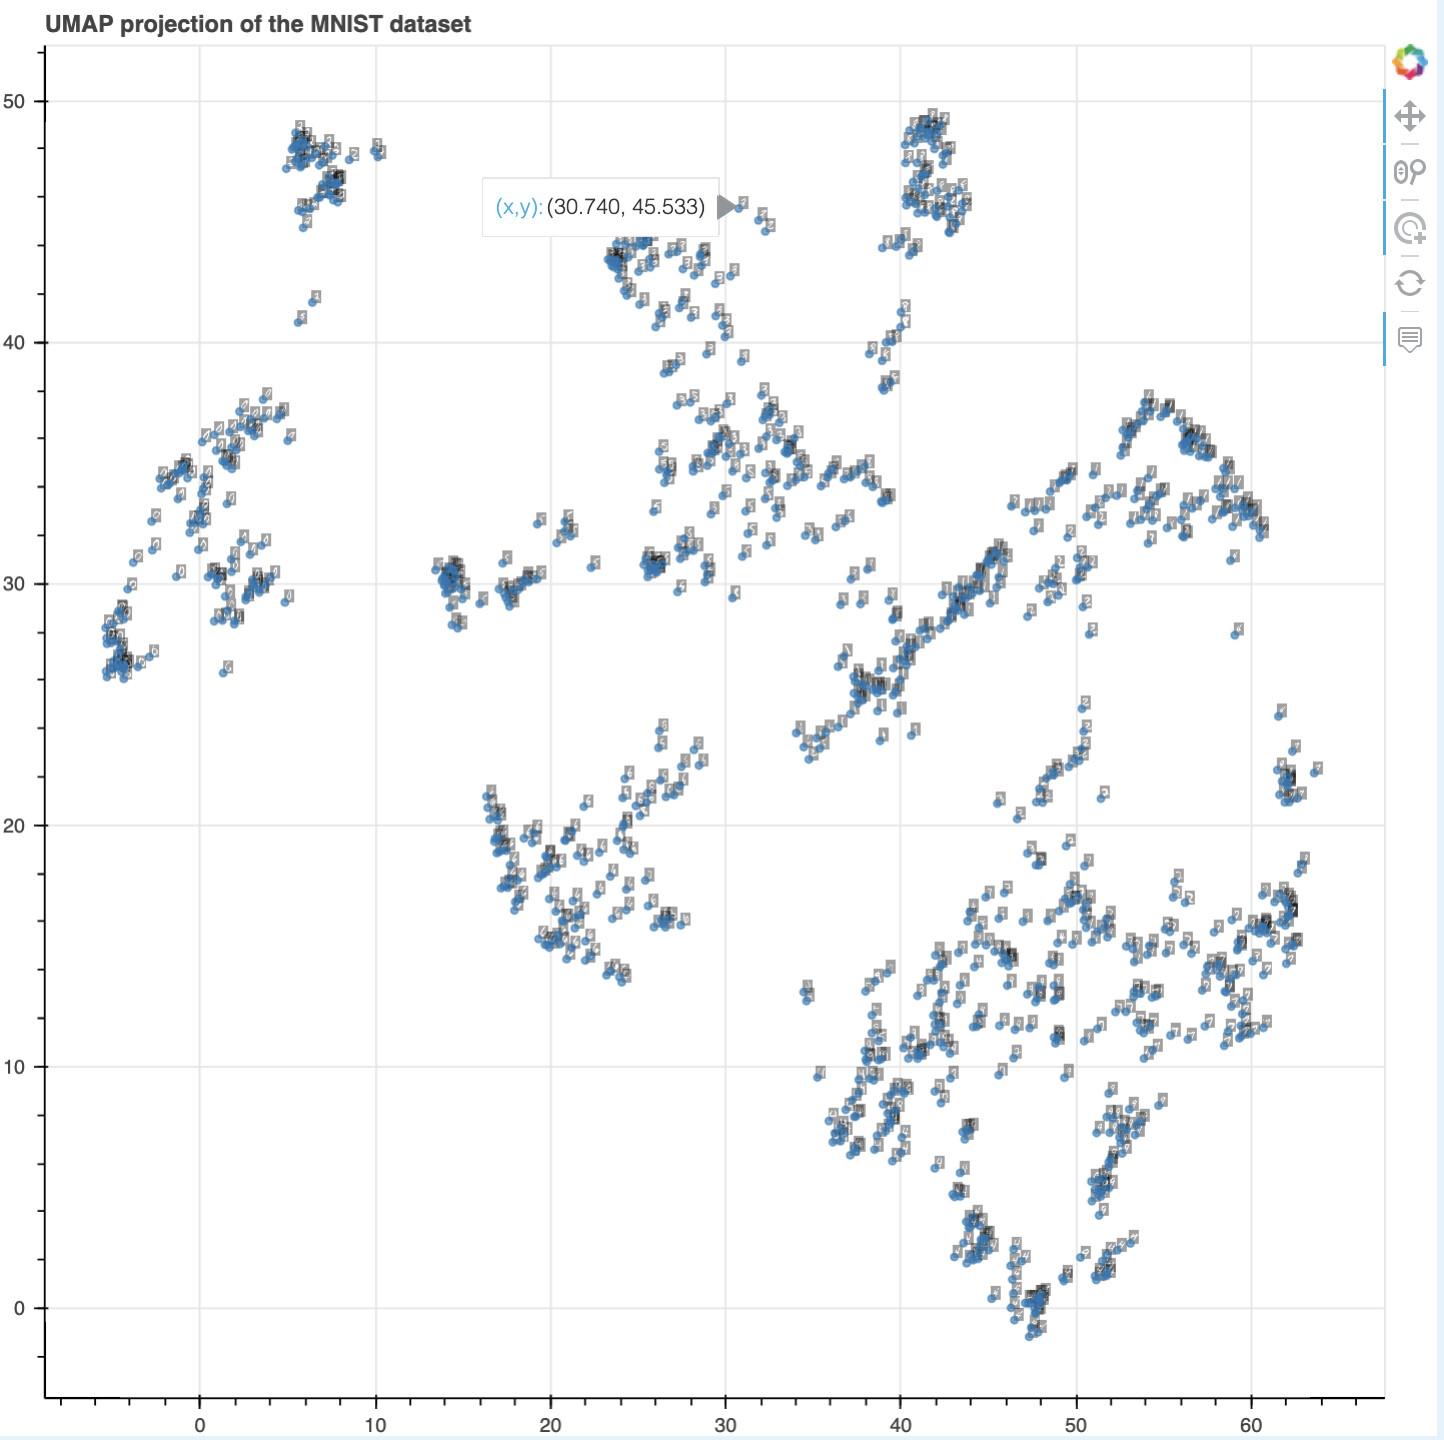
As we can see, the visualization demo can successfully plot the image via the image_rgba and show it on the canvas, as shown below:
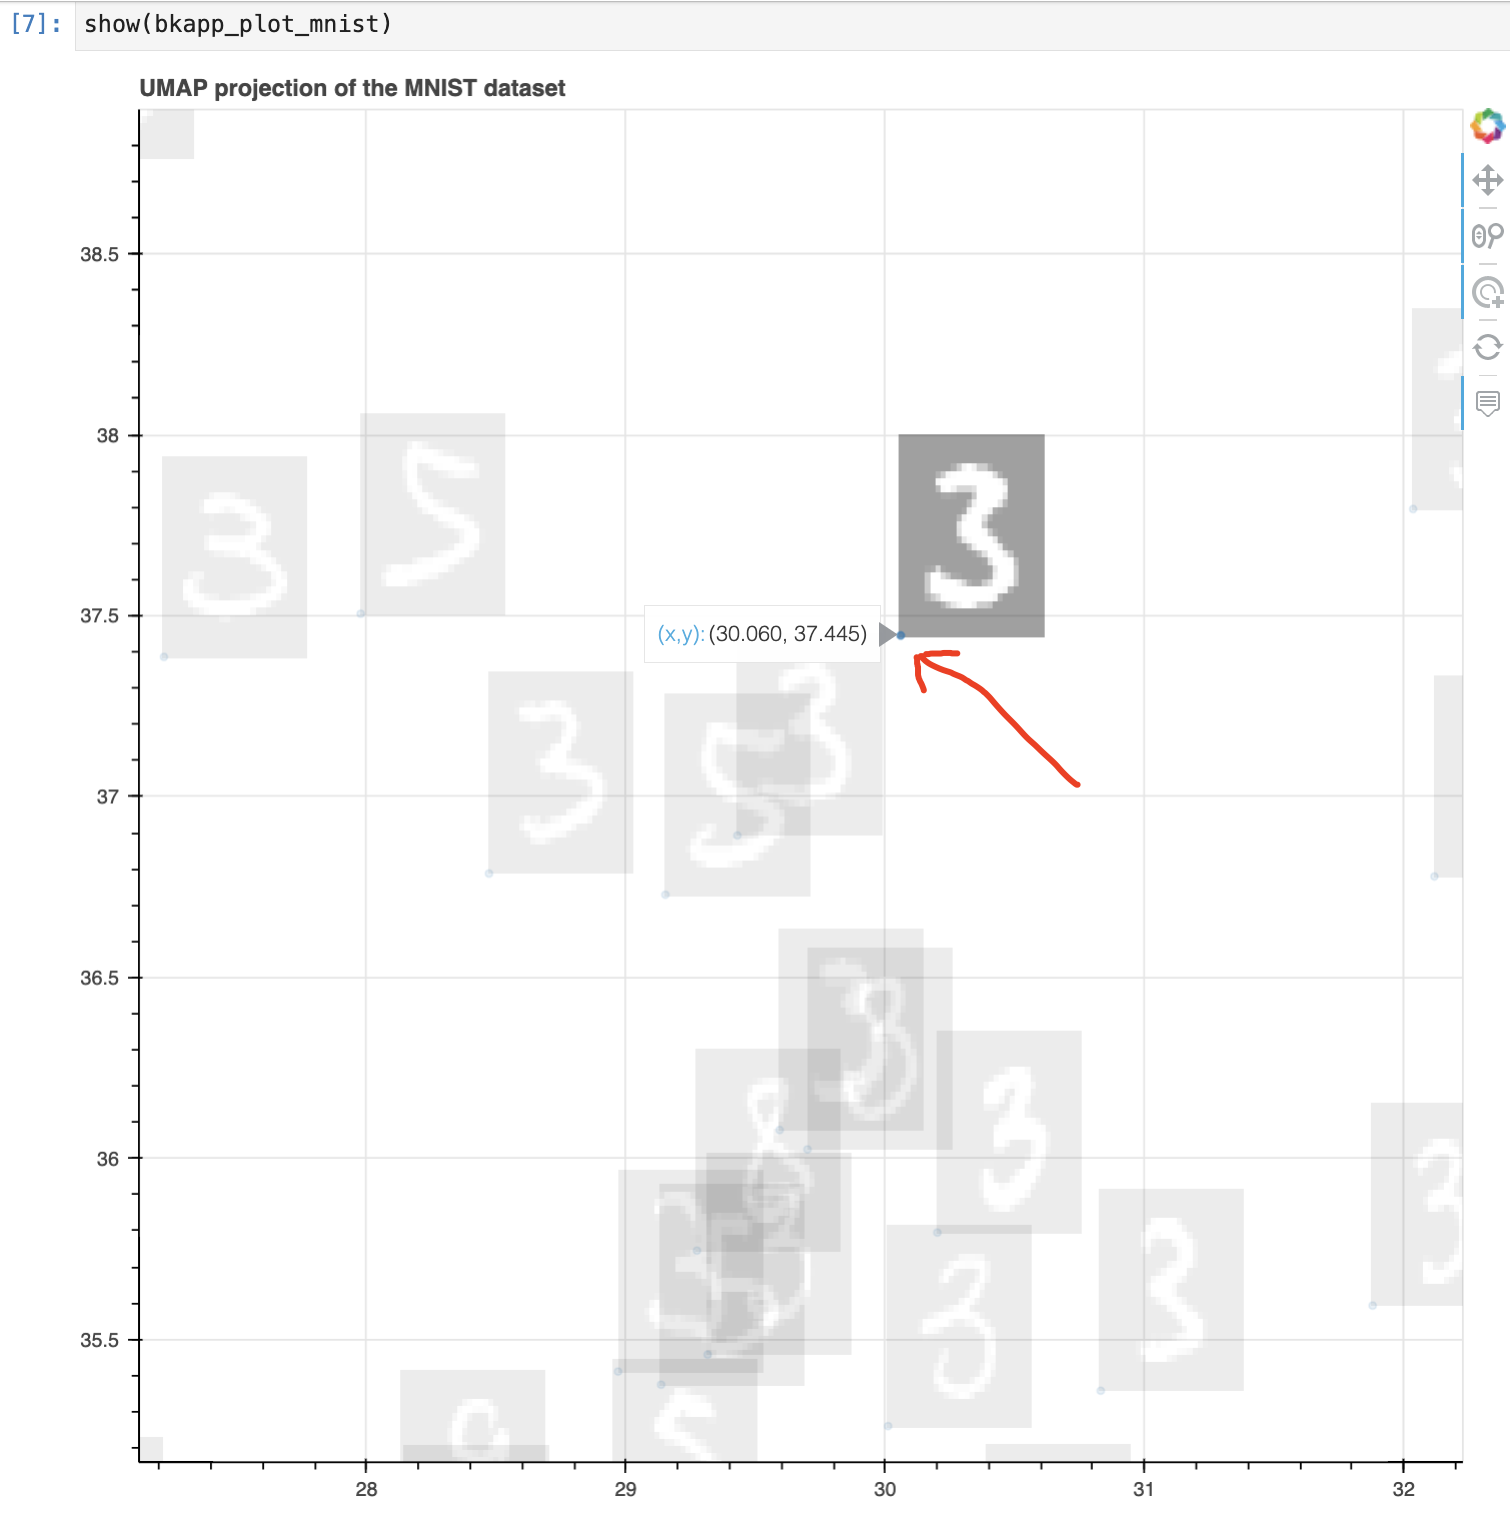
By zooming in, I can successfully show the image location by moving my mouse to the image’s area and hovering there, as in the example of image ‘3’ shown below.

However, when I try to tap/click on this image, I can not select and highlight it while making other images transparent. Nothing changes, as shown below.
But when I try to click on the small blue circle on the left bottom of that image, it seems like the image can be selected because the point/circle associated with the image is being selected. The corresponding code is:
plot_figure.image_rgba(source=source, image='image', x='x', y='y', dw='dw', dh='dh', alpha = 0.5)
plot_figure.circle(
    'x',
    'y',
    source=source,
    line_alpha=0.6,
    fill_alpha=0.6,
    size=4)
This is very weird at first glance, and it is inconvenient for me to interact since I need to zoom in very close to accurately click on the point/circle.
I also searched the internet and found that it seems like bokeh only defines the tap/select event for point/circle. However, this is very inconvenient for me to select the image since I may expect just to tap/click on an arbitrary pixel within the image, and then the image can be selected and highlighted.
Therefore, I want to know whether there is any way to define the tap/select event for image_rgba. Or are there any alternatives to do this, for example, create a rectangle that surrounds the image, and when I click on the rectangle, then I can highlight that image?
And could you explain why I can select the circle to highlight the image? What is the mechanism behind this? @Bryan, I am very interested in it since it seems like there should be a way that I can borrow some existing code in the bokeh to get the thing done.
It would also be very appreciated if you know any bokeh examples related to this issue.