How to delete/add rows in Bokeh heatmap and maintain row height?

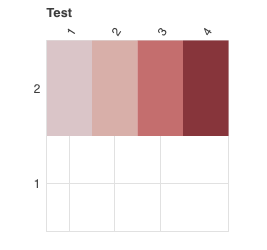
I’ve made a Bokeh heatmap linked to a CheckBoxGroup, so that the active items in the CheckBoxGroup correspond to the rows displayed in the heatmap. i.e. checking/unchecking boxes in the CheckBoxGroup adds or deletes rows in the heatmap. It all works fine except that I would like the rows of the heatmap to stay the same height regardless of how many rows are in the heatmap. What actually happens is the original height of the heatmap is retained and the rows resize to fit the original height.

I have a MWE here:

        from bokeh.io import output_file, show
        from bokeh.models import ColorBar, ColumnDataSource, LinearColorMapper
        from bokeh.plotting import figure
        from bokeh.transform import transform
        from bokeh.layouts import row, widgetbox
        from bokeh.models.callbacks import CustomJS
        from bokeh.models.widgets import CheckboxGroup
        import pandas as pd


        output_file("test.html")

        # set up data
        df = pd.DataFrame([["1", "1", 0.09], ["2", "1", 0.21], ["3", "1", 0.31], ["4", "1", 0.41],
                           ["1", "2", 0.5], ["2", "2", 0.61], ["3", "2", 0.71], ["4", "2", 0.81]],
                          columns=["x", "y", "values"])

        # source data for plot
        source = ColumnDataSource(df)

        # original source dataset, does not get changed
        savedsource = ColumnDataSource(df)

        # set up plot
        colors = ["#5A736F", "#75968f", "#a5bab7", "#c9d9d3", "#e2e2e2", "#dfccce", "#ddb7b1", "#cc7878", "#933b41",
                  "#550b1d"]
        mapper = LinearColorMapper(palette=colors, low=0, high=1)

        p = figure(title="Test", plot_width=200, plot_height=240,
                   x_range=["1", "2", "3", "4"], y_range=["1", "2"],
                   toolbar_location=None, tools="", x_axis_location="above")

        p.rect(x="x", y="y", width=1, height=1, source=source,
               line_color=None, fill_color=transform('values', mapper))

        p.axis.axis_line_color = None
        p.axis.major_tick_line_color = None
        p.axis.major_label_text_font_size = "9pt"
        p.axis.major_label_standoff = 0
        p.xaxis.major_label_orientation = 1.0

        # Create the checkbox selection element
        rows = ["1", "2"]
        selection = CheckboxGroup(labels=rows,
                                  active=[i for i in range(0, len(rows))])

        callback = CustomJS(args=dict(source=source, savedsource=savedsource, plot=p),
                            code="""

                    // get selected checkboxes
                    var active = cb_obj.active;

                    // get full original dataset
                    var origdata = savedsource.data;

                    // number of x-values
                    var numxs = plot.x_range.factors.length;

                    // this will be the new dataset
                    var newdata = {"index": [], "values": [], "x": [], "y": []};

                    // new y labels
                    var newlabels = [];

                    // slice out the data we want and put it into newdata
                    var i, j;
                    for (j=0; j<active.length; j++)
                    {
                        i = active[j]; // next active checkbox

                        newdata.index.push(...origdata.index.slice(i*numxs, i*numxs + numxs));
                        newdata.values.push(...origdata.values.slice(i*numxs, i*numxs + numxs));
                        newdata.x.push(...origdata.x.slice(i*numxs, i*numxs + numxs));
                        newdata.y.push(...origdata.y.slice(i*numxs, i*numxs + numxs));

                        newlabels.push(...origdata.y.slice(i*numxs, i*numxs + 1));
                    }

                    // replace the plot source data with newdata
                    source.data = newdata;

                    // update the yrange to reflect the deleted data
                    plot.y_range.factors = newlabels;
                    plot.y_range.end = newlabels.length;
                    source.change.emit();
                """)

        selection.js_on_change('active', callback)

        layout = row(widgetbox(selection), p)

        show(layout)

I’ve tried changing plot.plot_height and plot.height_policy but neither seemed to have any effect.

Answered on SO at javascript - How to delete/add rows in Bokeh heatmap and maintain row height? - Stack Overflow

I’ve responded on SO - that doesn’t do what I’m trying to do, as it removes the coloured rectangles in the row but leaves a blank row behind still with its label:

Screen Shot 2020-03-13 at 08.47.15

So you want to change the height of the plot?

I think so - the goal is to be able to delete/undelete entire rows, and adjust the height of the plot so that the individual row heights remain the same

To be honest, I highly doubt that it will end up being a good UX. But that’s beside the point.

I think you should be able to use inner_height attribute of the Plot class (figure returns an instance of Plot). But you will have to compute it yourself, and I’ve never seen it done before.

Thanks I’ll give it a shot.
Re UX I have a heatmap which starts with 164 rows and a use case where users filter down to 4 or 5 rows (my MWE is very over-simplified re filters). Current situation is either those 4 or 5 rows are expanded to fill the full 164 row space, or are spread out amongst 160 or so blank rows. Neither of those is pretty or useful.

I changed inner_height - and can see in the console that it took effect - but there’s no obvious effect on the figure itself.

inner_height is read-only (in Python you would get an exception). You will have to change the entire plot height, which includes the padding, so you would may want to control the top and bottom min padding as well.

@kmt Have you tried changing height through a CustomJS callback? I have one app where I adjust the height because the number of rows can change (observe I use FactorRange).

callback = CustomJS(args = dict(plot = plot), code = """
    var new_height;
    var n_fac = plot.y_range.factors.length;
    var row_height = 40;

    new_height = row_height * n_fac;

    plot.height = new_height;
    plot.properties.height.change.emit();
""")

plot.y_range.js_on_change('factors', callback)

Ahh thank you, that was enough information to get it working. I didn’t know about plot.properties.height.change.emit() and it seems frame_height is what needs to be adjusted. Here’s the final MWE code:

    from bokeh.io import output_file, show
    from bokeh.models import ColorBar, ColumnDataSource, LinearColorMapper
    from bokeh.plotting import figure
    from bokeh.transform import transform
    from bokeh.layouts import row, widgetbox
    from bokeh.models.callbacks import CustomJS
    from bokeh.models.widgets import CheckboxGroup
    import pandas as pd
    
   output_file("test.html")

    # set up data
    df = pd.DataFrame([["1", "1", 0.09], ["2", "1", 0.21], ["3", "1", 0.31], ["4", "1", 0.41],
                       ["1", "2", 0.5], ["2", "2", 0.61], ["3", "2", 0.71], ["4", "2", 0.81]],
                      columns=["x", "y", "values"])

    # source data for plot
    source = ColumnDataSource(df)

    # original source dataset, does not get changed
    savedsource = ColumnDataSource(df)

    # set up plot
    colors = ["#5A736F", "#75968f", "#a5bab7", "#c9d9d3", "#e2e2e2", "#dfccce", "#ddb7b1", "#cc7878", "#933b41",
              "#550b1d"]
    mapper = LinearColorMapper(palette=colors, low=0, high=1)

    p = figure(title="Test", plot_width=200, plot_height=240,
               x_range=["1", "2", "3", "4"], y_range=["1", "2"],
               toolbar_location=None, tools="", x_axis_location="above")

    p.frame_height = 240  # 2 rows of height 120

    p.rect(x="x", y="y", width=1, height=1, source=source,
           line_color=None, fill_color=transform('values', mapper))

    p.axis.axis_line_color = None
    p.axis.major_tick_line_color = None
    p.axis.major_label_text_font_size = "9pt"
    p.axis.major_label_standoff = 0
    p.xaxis.major_label_orientation = 1.0

    # Create the checkbox selection element
    rows = ["1", "2"]
    selection = CheckboxGroup(labels=rows,
                              active=[i for i in range(0, len(rows))])

    callback = CustomJS(args=dict(source=source, savedsource=savedsource, plot=p),
                        code="""

                        // get selected checkboxes
                        var active = cb_obj.active;

                        // get full original dataset
                        var origdata = savedsource.data;

                        // number of x-values
                        var numxs = plot.x_range.factors.length;

                        // this will be the new dataset
                        var newdata = {"index": [], "values": [], "x": [], "y": []};

                        // new y labels
                        var newlabels = [];

                        // slice out the data we want and put it into newdata
                        var i, j;
                        for (j=0; j<active.length; j++)
                        {
                            i = active[j]; // next active checkbox

                            newdata.index.push(...origdata.index.slice(i*numxs, i*numxs + numxs));
                            newdata.values.push(...origdata.values.slice(i*numxs, i*numxs + numxs));
                            newdata.x.push(...origdata.x.slice(i*numxs, i*numxs + numxs));
                            newdata.y.push(...origdata.y.slice(i*numxs, i*numxs + numxs));

                            newlabels.push(...origdata.y.slice(i*numxs, i*numxs + 1));
                        }

                        // replace the plot source data with newdata
                        source.data = newdata;

                        // update the yrange to reflect the deleted data
                        plot.y_range.factors = newlabels;
                        plot.y_range.end = newlabels.length;
                        
                        // update plot height
                        new_height = newlabels.length * 120; //rowheight is 120
                        plot.frame_height = new_height;
                        plot.properties.height.change.emit();
                    """)

    selection.js_on_change('active', callback)

    layout = row(widgetbox(selection), p)

    show(layout)