Please always provide a minimal but complete and runnable code. The reason you had no response so far is probably because you didn’t 
The code below is updating the ‘top’ attribute in the datasource each 0.5s with a random value (tested on v0.12.6).
You can also set the bar with by changing the 'Candle Period" via Select
Run the code as “bokeh serve --show main.py” or after uncommenting lines as “python main.py”
from bokeh.models import ColumnDataSource, Range1d, Whisker, Row
from bokeh.models.widgets import Select
from bokeh.plotting import figure, curdoc
from datetime import datetime, timedelta
from random import randint
import copy
from bokeh.client import push_session
def get_timestamp():
return (datetime.now() - datetime.utcfromtimestamp(0)).total_seconds() * 1000.0
open = 5
select_candle_period = Select(value = ‘1’, title = “Candle Period [min]”, options = [“1”, “15”, “30”, “45”, “60”], width = 150)
candle_width = int(select_candle_period.value) * 60 * 1000 / 2
source_vbars = ColumnDataSource({‘time’: [get_timestamp()], ‘bottom’: [open], ‘top’: [open], ‘color’: [‘green’], ‘width’: [candle_width]})
plot_main = figure(x_axis_type = ‘datetime’, tools = ‘pan,box_select,crosshair,resize,reset,save,wheel_zoom’, active_scroll = “wheel_zoom”)
plot_main.y_range = Range1d(start = 0, end = 10)
plot_main.x_range = Range1d(start = datetime.now() - timedelta(hours = 2), end = datetime.now() + timedelta(hours = 2))
v_bar = plot_main.vbar(x = ‘time’, bottom = ‘bottom’, top = ‘top’, width = ‘width’, color = ‘color’, name = “vbars”, source = source_vbars)
def update():
update_array = [‘top’, ‘color’, ‘width’]
timestamp_now = datetime.now()
timestamp_last = datetime.utcfromtimestamp(v_bar.data_source.data[‘time’][-1] / 1e3)
top = randint(1, 9)
width = int(select_candle_period.value) * 60 * 1000 / 2
color = “#EE2233” if top < open else (“#1E9C3D” if top > open else “#000000”)
for name in update_array:
exec('all_items_' + name + ' = copy.deepcopy(v_bar.data_source.data["' + name + '"])')
exec('all_items_' + name + '.pop()')
exec('all_items_' + name + '.append("' + str(eval(name)) + '")')
exec('v_bar.data_source.data["' + name + '"] = all_items_' + name)
if timestamp_now.minute != timestamp_last.minute and not (timestamp_now.minute % int(select_candle_period.value)):
new_source_data = dict(time = [get_timestamp()], bottom = [open], top = [top], color = [color], width = [width])
source_vbars.stream(new_source_data)
layout = Row(plot_main, select_candle_period)
curdoc().add_root(layout)
curdoc().add_periodic_callback(update, 500)
session = push_session(curdoc())
session.show(layout)
session.loop_until_closed()
``
···
On Friday, January 11, 2019 at 5:34:26 PM UTC+1, peng wang wrote:
Hi guys,
I plot some vbars.
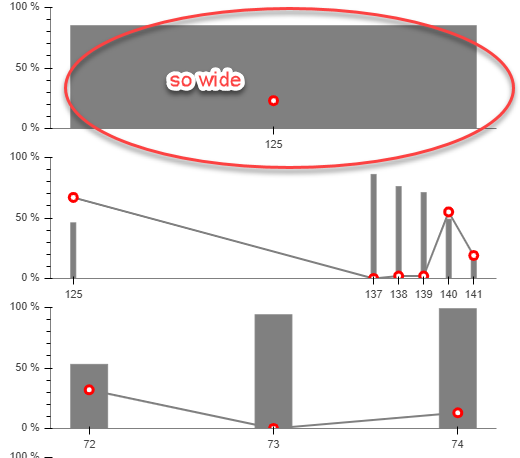
If there is only one vbar, its’ width is pretty big. I like to narrow it a little bit, let us say width = 0.2. The follow is my solution, but, it does not work. If some guys may let me know the reason, that would be great. thanks
rig_plot = figure(#x_range = FactorRange(), \
plot_width = 500, \
plot_height = 150, \
toolbar_location = None)
rig_plot_vbar = rig_plot.vbar(x = ‘x’, \
width = ‘vbarwidth’, \
bottom = 0, \
top = ‘y1’, \
source = rig_source, \
color = ‘grey’)
``
def update_rigs_data_dict():
rig_data_dict = {}
    rig_data_dict['vbarwidth'] = vbarwidth_list

    return rig_data_dict
``
this one does not work
def update_rig_source(rig_data_dict):
rig_source.data = dict(x = […], \
y1 = […], \
vbarwidth = rig_data_dict[‘vbarwidth’])
``
this one also does not work
def update_width():
rig_plot.glyph.width = 0.1
``
need render? not sure
Welcome any feedback.