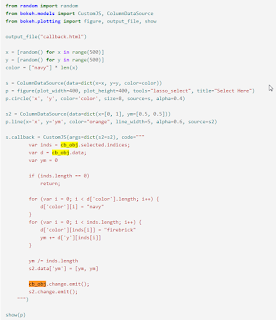
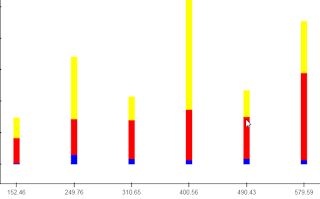
If I click on a vbar and try to get the source and handle source data a in CustomJS, Does the following help to work out? thanks a lot
Hi,
Images of code are not helpful, please post (or link) to actual text code so that people can easily run the code to try it out.
Thanks,
Bryan
···
On Jun 13, 2018, at 16:20, peng wang <[email protected]> wrote:
If I click on a vbar and try to get the source and handle source data a in CustomJS, Does the following help to work out? thanks a lot
--
You received this message because you are subscribed to the Google Groups "Bokeh Discussion - Public" group.
To unsubscribe from this group and stop receiving emails from it, send an email to [email protected].
To post to this group, send email to [email protected].
To view this discussion on the web visit https://groups.google.com/a/continuum.io/d/msgid/bokeh/e67b3bfc-b6f6-43de-8e56-22d06061a55e%40continuum.io\.
For more options, visit https://groups.google.com/a/continuum.io/d/optout\.
Thanks a lot for reminding me. Basically , I plot each stackedvbars by using 3 vbars one over one, and I am trying to click(tap) on each vbar and handle the individual logic in CustomJS function. for example, I like to display or hide another figure(subplot). currently, I do not know how I can tell each vbar. any help will be highly appreciated.
b2s_list = list(map(float, all_connection_dict[‘PreSlipTime(min)’]))
s2s_list = list(map(float, all_connection_dict[‘SlipToSlip(min)’]))
s2b_list = list(map(float, all_connection_dict[‘PostSlipTime(min)’]))
b2s_s2s_list = list(map(add, b2s_list, s2s_list))
b2s_s2s_s2b_list = list(map(add, b2s_s2s_list, s2b_list))
all_connection_dict[‘PreSlipTime(min)’] = b2s_list
all_connection_dict[‘SlipToSlip(min)’] = s2s_list
all_connection_dict[‘PostSlipTimeBottom’] = b2s_s2s_list
all_connection_dict[‘TotalTop’] = b2s_s2s_s2b_list
all_connection_source = ColumnDataSource(data=all_connection_dict)
novos_source = ColumnDataSource(data=novos_connection_dict)
main_plot = figure(x_range=all_connection_dict[‘HoleDepth’], plot_height=150, tools = “tap, pan, wheel_zoom, xbox_select, reset”, sizing_mode=‘scale_width’,title=“Click the Vbar”)
main_plot.legend.legend_spacing = 10
main_plot.legend.legend_padding = 50
add one column to identify different vbar
generate 3 ColumnDataSource individually
all_connection_dict[‘VBarType’] = [‘B2S’ for item in b2s_s2s_s2b_list]
b2s_source = ColumnDataSource(data=all_connection_dict)
all_connection_dict[‘VBarType’] = [‘S2S’ for item in b2s_s2s_s2b_list]
s2s_source = ColumnDataSource(data=all_connection_dict)
all_connection_dict[‘VBarType’] = [‘S2B’ for item in b2s_s2s_s2b_list]
s2b_source = ColumnDataSource(data=all_connection_dict)
remove VBarType from dict
for i in all_connection_dict:
if ‘VBarType’ in all_connection_dict[i]:
all_connection_dict[i].pop(‘VBarType’)
main_plot.vbar(x=‘HoleDepth’, width=0.1, bottom=0, top=‘PreSlipTime(min)’, color=“blue”, source=b2s_source)
main_plot.vbar(x=‘HoleDepth’, width=0.1, bottom=‘PreSlipTime(min)’, top=‘PostSlipTimeBottom’, color=“red”, source=s2s_source)
main_plot.vbar(x=‘HoleDepth’, width=0.1, bottom=‘PostSlipTimeBottom’, top=‘TotalTop’, color=“yellow”, source=s2b_source)
main_plot.toolbar.logo = None
taptool = main_plot.select(type=TapTool)
#subplot
subplot_x = [7, 13, 19, 25, 31, 37, 7, 13, 19, 25, 31, 37]
subplot_y = [20, 20, 20, 20, 20, 20, 25, 25, 25, 25, 25, 25]
subplot = figure(x_range = [0, 50], y_range = [0, 30], plot_width=100, plot_height=50, toolbar_location=None, sizing_mode=‘scale_width’)
subplot_height = 50
subplot_weight = 100
subplot.rect(x=subplot_x, y=subplot_y, width=subplot_weight, height=subplot_height, color=“#CAB2D6”,
width_units=“screen”, height_units=“screen”)
subplot.text(x=5.5, y=25, text_font_size=‘8pt’, text=[“Offbottom-Active”])
subplot.add_layout(Arrow(end=NormalHead(line_color=“firebrick”, line_width=4),
x_start=9, y_start=25, x_end=11, y_end=25, line_width=15))
#subplot.xaxis.visible = None
#subplot.yaxis.visible = None
subplot.background_fill_color = “white”
m_color_white = subplot.background_fill_color
subplot.outline_line_color = None
#show or hide
code = “”"
selection = require(“core/util/selection”)
indices = selection.get_indices(allSource)
m_color = subplot.background_fill_color
subplot.background_fill_color = ‘blue’
subplot.background_fill_color = mainplot.background_fill_color
for (i = 0; i < indices.length; i++) {
ind = indices[i]
holedepth = allSource.data[‘HoleDepth’][ind]
novosSource.data[‘HoleDepth’]
}
“”"
taptool.callback = CustomJS(args=dict(allSource=all_connection_source, novosSource=novos_source, main_plot=main_plot, subplot=subplot),code=code)
hide_subplot_callback = CustomJS(args=dict(m_color=m_color_white, subplot=subplot), code=“”"
subplot.background_fill_color = ‘white’
“”")
main_plot.js_on_event(events.DoubleTap, hide_subplot_callback)
``
···
On Wednesday, June 13, 2018 at 5:22:32 PM UTC-6, Bryan Van de ven wrote:
Hi,
Images of code are not helpful, please post (or link) to actual text code so that people can easily run the code to try it out.
Thanks,
Bryan
On Jun 13, 2018, at 16:20, peng wang [email protected] wrote:
If I click on a vbar and try to get the source and handle source data a in CustomJS, Does the following help to work out? thanks a lot
–
You received this message because you are subscribed to the Google Groups “Bokeh Discussion - Public” group.To unsubscribe from this group and stop receiving emails from it, send an email to [email protected].
To post to this group, send email to [email protected].
To view this discussion on the web visit https://groups.google.com/a/continuum.io/d/msgid/bokeh/e67b3bfc-b6f6-43de-8e56-22d06061a55e%40continuum.io.
For more options, visit https://groups.google.com/a/continuum.io/d/optout.
Or, if I create three sources for each colored vbar, how could I get the corresponding source associated with? thanks a lot
I have source code, If anyone needs, I like to share
···
On Wednesday, June 13, 2018 at 5:39:01 PM UTC-6, peng wang wrote:
Or, if I create three sources for each colored vbar, how could I get the corresponding source associated with? thanks a lot
On Wednesday, June 13, 2018 at 5:20:36 PM UTC-6, peng wang wrote:
If I click on a vbar and try to get the source and handle source data a in CustomJS, Does the following help to work out? thanks a lot

