How to get vertices (points of corners) of a square?

I’m working on drawing tools over an image and somehow i have to use coordinates of a model (i.e square) for calculation. I’ve been searching in the document but I couldn’t find any method.

Here I have an attachment with a square over the image. I would like to get its corners’ points (x,y). Anyone here is familiar with it? I really appreciate your help.

You need to provide more information, ideally a Minimal Reproducible Example. Where is this square generated from? A BoxEditTool? Some custom tool you wrote? Something else? There is no way to speculate without details (code).

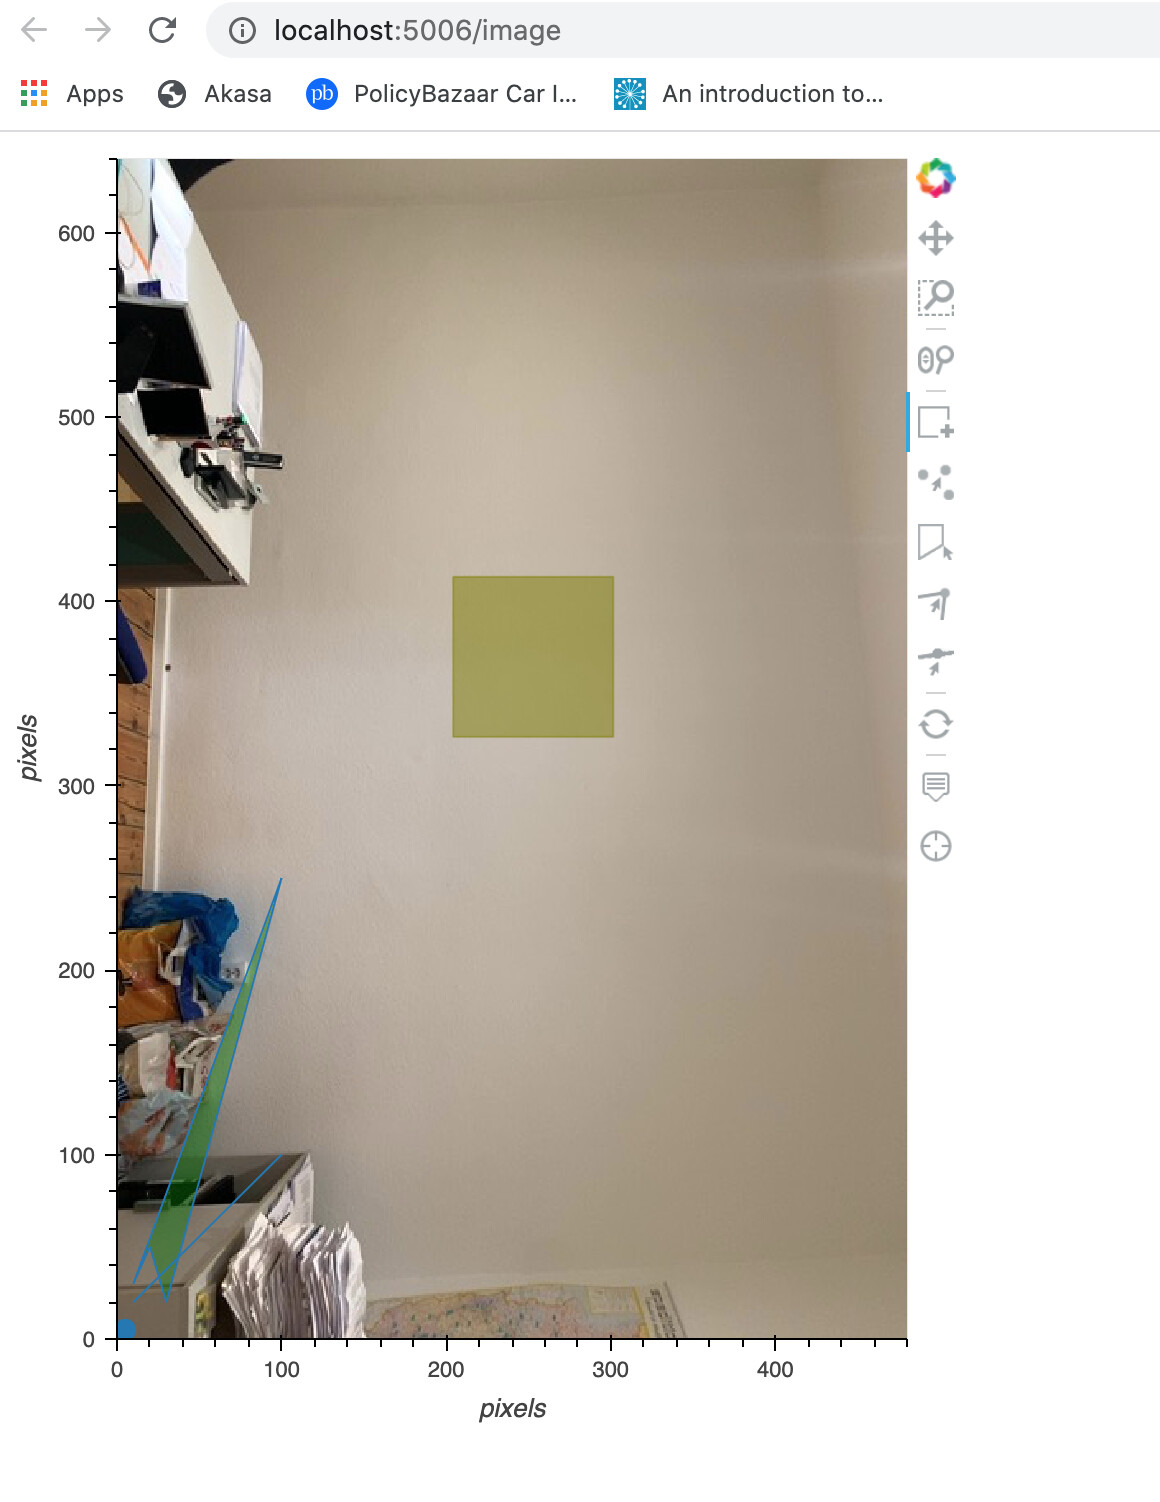
Thank you Bryan for pointing out. The square is generated from figure.square() and I also put it in the renderer of BoxEditTool for drag and drop (and of course I would also love to resize it in the future).

Here is code example:

import numpy as np
import skimage
import skimage.io

# Import Bokeh modules for interactive plotting
import bokeh.io
from bokeh.models import (BoxEditTool, 
                      PointDrawTool, 
                      PolyDrawTool,
                      PolyEditTool, 
                      LineEditTool,
                      ColumnDataSource)

import bokeh.palettes
import bokeh.plotting

from bokeh.layouts import column
from bokeh.plotting import  (
                          figure, 
                          curdoc, 
                          output_file, 
                          show
                        )

def bokeh_imshow(im, color_mapper=None, plot_height=400, length_units='pixels', 
             interpixel_distance=1.0):
 
 # Get shape, dimensions
 n, m, _ = im.shape
 dw = m * interpixel_distance
 dh = n * interpixel_distance

 # Set up figure with appropriate dimensions
 s = ColumnDataSource(data = dict(x=[0,1],y=[0,1])) #points of the line
 callback = bokeh.models.CustomJS(args=dict(s=s), code="""
        var geometry = cb_data['geometry'];
      console.log(geometry);
        var x_data = geometry.x; // current mouse x position in plot coordinates
        var y_data = geometry.y; // current mouse y position in plot coordinates
        console.log("(x,y)=" + x_data+","+y_data); //monitors values in Javascript console
 """)
 hover_tool = bokeh.models.HoverTool(callback=callback)
 plot_width = int(m/n * plot_height)
 p = bokeh.plotting.figure(plot_height=n, 
												plot_width=m, 
                        x_range=[0, m], 
                        y_range=[0, n], 
                        x_axis_label=length_units,
                        y_axis_label=length_units,
                        tools= [hover_tool,
                    		"crosshair,box_zoom,wheel_zoom,pan,reset"])


 p.line(x='x', y='y', source=s)

 # Set color mapper; we'll do Viridis with 256 levels by default
 if color_mapper is None:
    color_mapper = bokeh.models.LinearColorMapper(bokeh.palettes.viridis(256))

 # Display the image
 # https://stackoverflow.com/questions/52433129/python-bokeh-get-image-from-webcam-and-show-it-in-dashboard
 img = np.empty((n, m), dtype=np.uint32)
 view = img.view(dtype=np.uint8).reshape((n, m, 4))
 view[:,:,0] = im[:,:,0] # copy red channel
 view[:,:,1] = im[:,:,1] # copy blue channel
 view[:,:,2] = im[:,:,2] # copy green channel
 view[:,:,3] = 255
 img = img[::-1] # flip for Bokeh
 im_bokeh = p.image_rgba(image=[img], x=0, y=0, dw=m, dh=n)

 # add a square renderer with a size, color, and alpha
 sqr_source = ColumnDataSource(data=dict(x=[50], y=[50]))
 sqs = p.square(x='x', y='y', source=sqr_source, size=80, color="olive", alpha=0.5)

 # create ColumnDataSource from a dict
 source = ColumnDataSource(data=dict(x=[1, 2, 3, 4, 5], y=[1, 2, 3, 4, 5]))
 c1 = p.circle(x="x", y="y", size=10, hover_color="red", source=source)
 tool1 = PointDrawTool(renderers=[c1])

 # add box editable tool
 source1 = ColumnDataSource(data=dict(x=[5], y=[5]))
 source2 = ColumnDataSource(data=dict(x=[2], y=[3]))
 r1 = p.rect(x='x', y='y', width=10, height=5, source=source1)
 r2 = p.rect(x='x', y='y', width=5, height=5, source=source2)
 tool2 = BoxEditTool(renderers=[r1, r2, sqs], empty_value=1)

 p1 = p.patches([], [], fill_alpha=0.4)
 ps = ColumnDataSource(data=dict(xs=[[10, 20, 30, 100]], ys=[[30, 50, 20, 250]]))

 def show_updated_source(attr, old, new):
    print(attr)
    print(old)
    print(new)

 ps.on_change('data', show_updated_source)
 p2 = p.patches(xs='xs', ys='ys', fill_color='green', fill_alpha=0.4, source=ps)
 c1 = p.circle([], [], size=10, color='red')
 draw_tool = PolyDrawTool(renderers=[p1, p2])
 edit_tool = PolyEditTool(renderers=[p1, p2], vertex_renderer=c1)

 line_source = ColumnDataSource(data = dict(x=[10, 100], y=[20, 100]))
 edit_line = p.line(x='x', y='y', source=line_source)
 c2 = p.circle([], [], fill_color="white", size=8)
 edit_line_tool = LineEditTool(renderers=[edit_line], intersection_renderer=c2)

 p.add_tools(tool1, tool2, draw_tool, edit_tool, edit_line_tool)

 return p


im = skimage.io.imread('wand.jpg') # Returned image: RGB-image MxNx3 or RGBA-image MxNx4
p = bokeh_imshow(im, plot_height=680, interpixel_distance=0.0636)


# put the plot in a layout and add to the document
curdoc().add_root(column(p))

My goal is to access vertices of Polygon(xy of all connected points eg. in matplotlib it’s easy to access via polygon.xy), Line(xy of the connected points), and Square (corners’ points).

Your code has both rect and square it’s not really clear how they are related, or which one you are really referring to. Squares are “point” scatter markers, they only have a size in screen (pixel) dimensions. The data space coordinates of their corners are never even computed, but if they were it would only be in the browser. It will be difficult/impossible to get that information for square.

So, instead, you should use rect for anything you need those coordinates for, because rect coordinates are in data-space to begin with. If the rects are updated from a BoxEditTool, so then the data that drives the rects is in source.data like any other glyph, and can be observed to change via JS or python callbacks on source.data

in matplotlib it’s easy to access via polygon.xy

In Matplotlib all the work and computations happen in Python, in the same process. Most of the actual work done by Bokeh is actually done in the browser, by BokehJS.

I’m mainly referring to the square but if it’s impossible to get its corners coordinates I have to think of another way, rect. However, I would like to emphasize again that it would be able to compute from bokehjs or certainly not.

On the other hand, rect data source could provide only one point(x,y) so could you kindly help point out to grab its corners data coordinates (i.e 4 corner points)? Like polygons or patches, you can see that we can get all points.

if it’s impossible

It’s not impossible, but it’s also no easy or simple or done with any APIs that we normally demonstrate. Square has a center coordinate in data-space, and a size (in pixel/screen space). So. to get the corner coordinates, you would have to: convert the center data coordinate to a screen coordinate, apply the size to compute the corner screen coordinates, then apply the inverse mapping to convert those screen coordinate back in to data-space coordinate. And BTW of course, remember, the size is in pixels so anything that changes the scale (e.g. a zoom) will make those data-space coordinates of the corners change.

If you need the corner coordinates to be stable in data-space even after zooms, etc then a square is just absolutely the wrong thing to use to begin with, because it was not created for that. The intended purpose of square is as a “point” scatter maker, that has a constant size in pixels, regardless of scale.

All that said, if this is really what you want to pursue, the things you should look to for reference in the BokehJS codebase are calls to v_compute (to map data space into screen space) and v_invert (to map screen space into data space)

On the other hand, rect data source could provide only one point(x,y)

Rects are specified by a single point, and a width and a height (all in data-space dimensions). You would need to compute the corner coordinates from that information.

I suppose it’s also worth mentioning, what you are after is actually a polygon with explicit coordinates for every point, that is the patches glyph. But the edit tool for patches allows any polygon to be drawn, and won’t constrain users to only drawing rects/squares. It’s unclear what your actual requirements are, though.

The code example I provided here is a mixture of various objects that I tested out to see what Bokeh can offer. My main purpose here is the square; whether it could be resizable and its corner points could be retrievable for further calculation purpose. But, if it’s too difficult I will look into rect instead and my purpose with rect (resizable and computable 4 corner points) is the same as square.

This seems to me that the square cannot resonate with my requirement anyway so rect would be my next pursue. However, I’m wondering why rect could not be resized through BoxEditTool like PolyEditTool or LineEditTool.

For user experience, resizing patches glyph point by point for mapping an object in the image is not satisfying in my case while resizable square/rect would be better option. Due to complexity, I have to reconsider the other way around.

Finally, I would like to restate that I’m trying to have a resizable tool (ideally square/rect for good user experience) to map with any object in the image and then grab their 4 corner points to do more calculation (eg. calculating points distance)

However, I’m wondering why rect could not be resized through BoxEditTool

I’m not sure where you got this notion, but it is not correct. In fact, BoxEditTool only works with rect, see the documentation:

https://docs.bokeh.org/en/latest/docs/user_guide/tools.html?highlight=boxedittool#boxedittool

The BoxEditTool() allows you to draw, drag, and delete Rect glyphs

I’m trying to point out that I cannot resize the rect like patches glyph via vertex_renderer and line via intersection_renderer. Or there is a way that I couldn’t find in the doc. I really appreciate if you could help refer to :slight_smile:

@Sinal_Meas It is literally the first code block, immediately after the first sentence, in the link I posted above:

r1 = p.rect('x', 'y', 'width', 'height', source=source)
r2 = p.rect('x', 'y', 'width', 'height', source=source2)
tool = BoxEditTool(renderers=[r1, r2])

The parameter name is just renderer in this case, because calling it vertex_renderer would be misleading and incorrect with respect to what it actually does:

The tool automatically modifies the columns of the data source corresponding to the x , y , width , and height values of the [rect] glyph.

i.e. it does modify rects (size or position), but not by modifying any vertices.

Thank you Bryan. Surely, BoxEditTool enables me to draw, draw and delete any rect glyph, and I understand that the tool automatically updates the corresponding data source. Last point I really want to know if I can resize it by moving corners handlers (or I have to do on my own). If you look at PolyEditTool and LineEditTool, after double tap you can adjust the size of the glyphs moving red points.

If the functionality is not available, is there any possible ability that you can suggest so that I can work out on that?

No, there is not

You might consider opening a GitHub Issue to request adding the ability to edit rects by moving their vertices as a new feature.

Thank you @Bryan for all responses. I’ll create an issue in Github issue.