I added two range tools to a plot and I want them both to be active at the same time is it possible?
In addition, if it’s possible, is there a way to remove their icons from the toolbar?
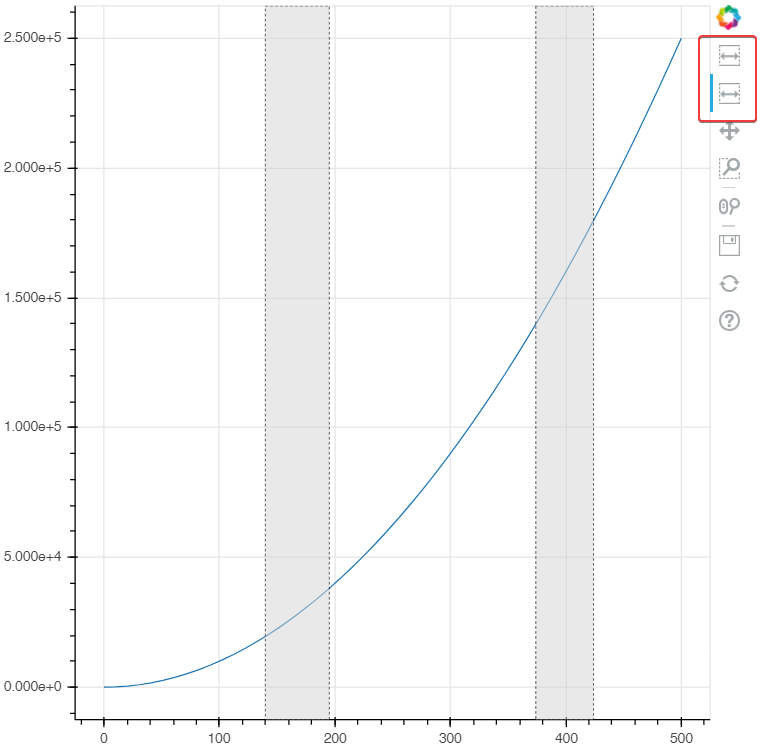
What would having two active range tools achieve? Do you just want to change two ranges with a single plot interaction?
Regarding hiding icons - nothing built-in, but you can use custom CSS for that.
@p-himik
Thanks for your reply!
I’m invoking an analysis script that gets as input the bounds of two ranges. so the user needs to place the ranges where he wants and click a button that will trigger the analysis. I’m afraid It’s not so intuitive for the user to click on the right range tool toolbar icon in order to activate it (my instinct was to try modify the ranges without activating them first).
BTW, is there an option to make the range tools toolbar icons distinguishable by coloring them or something like that?
I see. Well, right now Bokeh doesn’t allow multiple tools of the same interaction type be active at the same time. The best workaround that I can think of is to create a custom tool model that does what you want.
Regarding distinguishable icons - the answer is the same as before, it can be done with CSS. Or with a custom tool button model.
@p-himik
I understand…Thank you for your help!! 
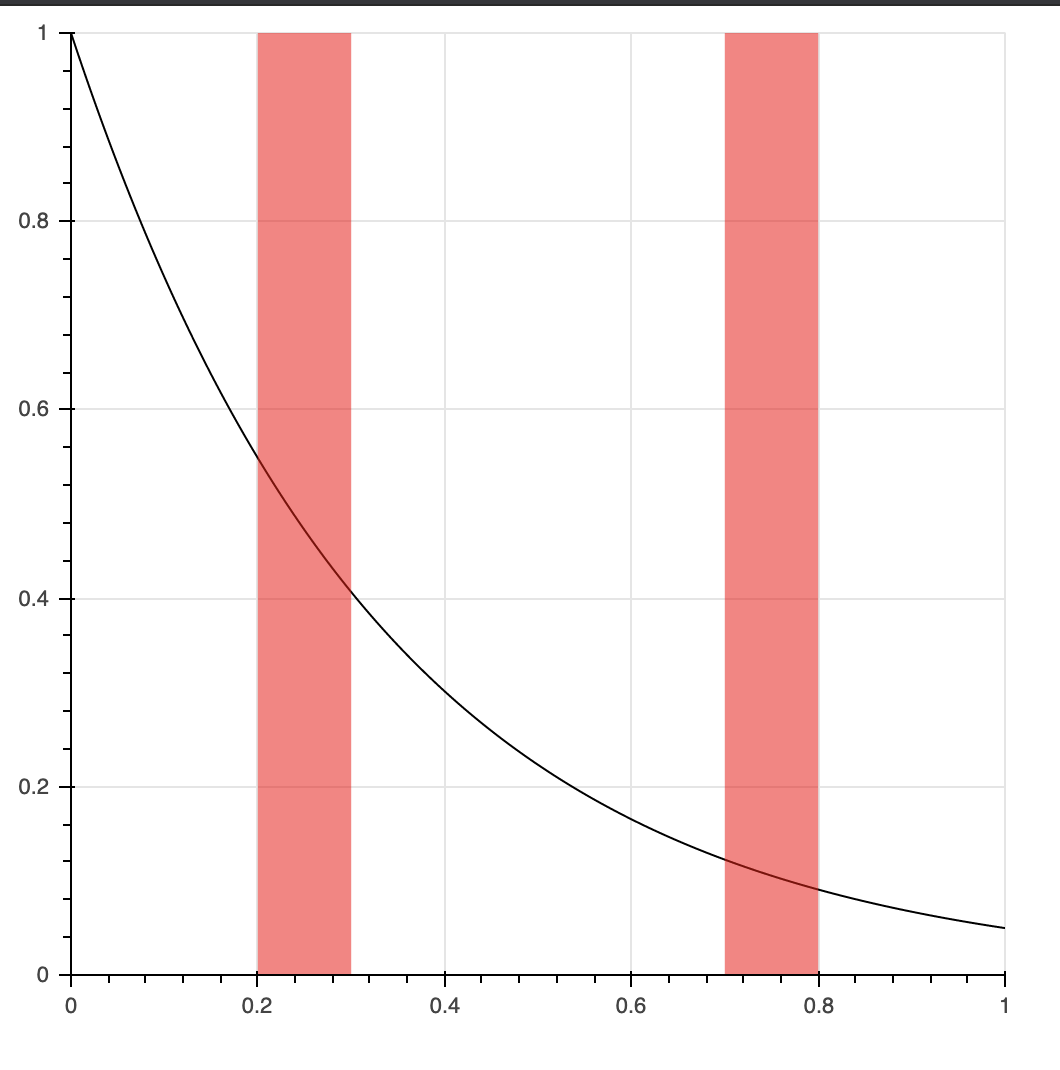
Another option, which admittedly has its own quirks and/or limitations in terms of user interaction is to use a BoxEditTool exploiting the add action.
A simple example follows. When a user holds the shift key in combination with a mouse-gesture a new rectangle is added/drawn on the figure, which can be used as a proxy for a proper range area.
By setting the num_objects property of the tool, the number of rectangles (i.e. ranges) is limited, always discarding the oldest one whenever a new rectangle is drawn.
Also note that setting the dimensions property to 'width' constrains the interactively drawn area to only vary in width so that it always spans the vertical range of the plot.
Presumably you can inspect the updated rectangles’ ColumnDataSource in your callback to infer the ranges for the analysis problem.
#!/usr/bin/env python3
# -*- coding: utf-8 -*-
"""
"""
import numpy as np

from bokeh.plotting import figure, show
from bokeh.models import ColumnDataSource, BoxEditTool

x = np.linspace(0.0,1.0,1001)
y = np.exp(-3.0*x)
data = dict(x=x, y=y)

p = figure(width=500, height=500, toolbar_location=None, x_range=(0.0,1.0), y_range=(0.0,1.0))

ln = p.line(x='x', y='y', source=ColumnDataSource(data=data), line_color='#000000')

data = dict(x=[0.25,0.75], y=[0.50,0.50], w=[0.10,0.10], h=[1.00,1.00])
r = p.rect(x='x', y='y', width='w', height='h',
           source=ColumnDataSource(data=data),
           fill_color='#ff0000', fill_alpha=0.5,
           line_color=None)

tool = BoxEditTool(renderers=[r], dimensions='width', empty_value='#ff0000', num_objects=2)

p.add_tools(tool)
p.toolbar.active_drag = tool

show(p)
@_jm thanks for your reply!
I gave it a try but I think the range tool is a better fit for me. Plus, as you said, it has its own quirks and limitations.