I’ve created a correlation matrix with multilevel categorical axes:
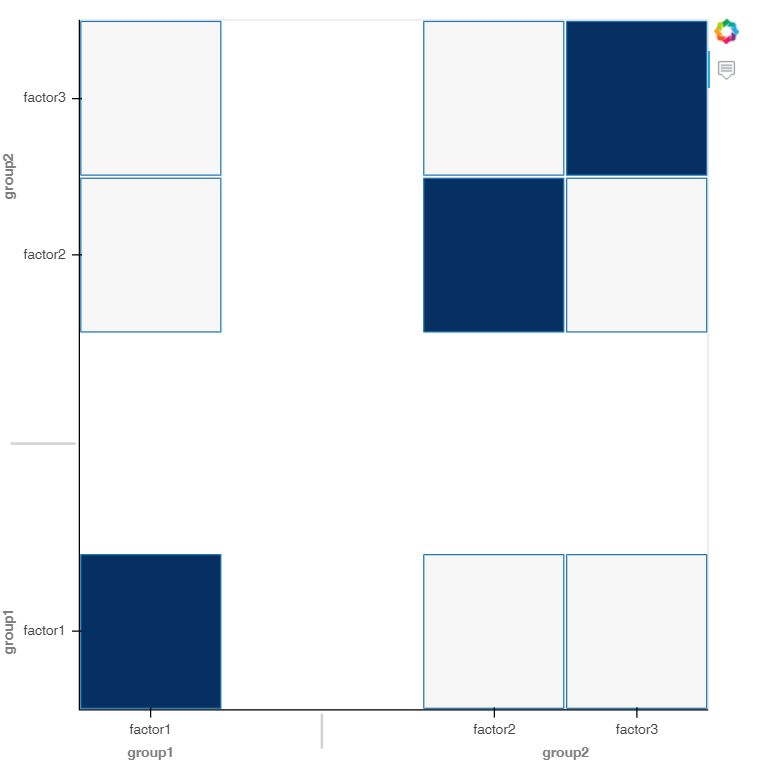
As you can see, the groups are too far from one another.
Is there a way to make them closer?
I’ve created a correlation matrix with multilevel categorical axes:
Apparently, I just needed to look in the documentation!
There’s a property for the FactorRange class that’s called group_padding.
So modifying the space between the groups should be as easy as:
plot.x_range.group_padding = <whatever>