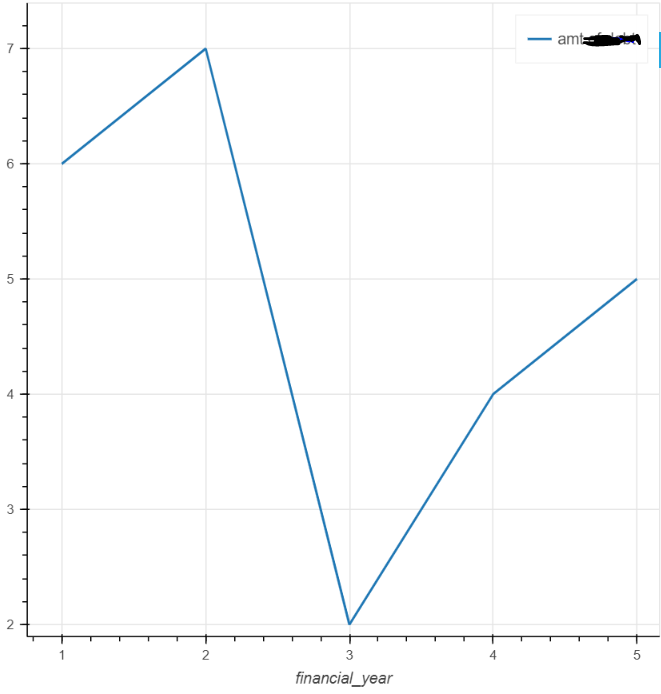
I am trying to make my x and y-axis plot to extract the data from my csv file instead of 1,2,3,…,7 which is not meaningful. How can I do it?
> from bokeh.plotting import figure, show
>
> data = pd.read_csv(amtsaved.csv')
> data.head()
>
> # create a new plot with a title and axis labels
> p = figure(title="amt saved", x_axis_label="year", y_axis_label="year")
>
> # add a line renderer with legend and line thickness
> p.line(x, y, legend_label="amt saved", line_width=2)
>
> # show the results
> show(p)