I’m plotting 2d heatmap, both axis are dates.
%pyspark

from pyspark.sql.functions import *
from bokeh.models import ColumnDataSource, ColorBar, LogColorMapper


def plot_summaries_heatmap(sensor, dfName):
    dft = sqlContext.table(dfName)
    pdf = dft.toPandas()

    import pandas as pd
    import numpy as np

    from bokeh.transform import log_cmap
    color_mapper = log_cmap('index','Viridis256',low=1,high=10)
    rowIDs = pdf[sensor]
    colIDs = pdf['window_time']

    A = pdf.pivot_table('count', sensor, 'window_time', fill_value=0)

    source = ColumnDataSource(data={'x':[pdf['window_time'].min()] #left most
                               ,'y':[0] #bottom most
                               ,'dw':[pdf['window_time'].max()-pdf['window_time'].min()] #TOTAL width of image
                               ,'dh':[pdf[sensor].max()] #TOTAL height of image
                               ,'im':[A.to_numpy()] #2D array using to_numpy() method on pivotted df
                               })

    color_mapper = LogColorMapper(palette="Viridis256", low=0, high=pdf['count'].max())

    plot = figure(toolbar_location=None,x_axis_type='datetime',y_axis_type='datetime')
    plot.image(x='x', y='y', source=source, image='im',dw='dw',dh='dh',  color_mapper=color_mapper)

    color_bar = ColorBar(color_mapper=color_mapper, label_standoff=12)

    plot.add_layout(color_bar, 'right')
    show(gridplot([plot], ncols=1, plot_width=1600, plot_height=900))

   sensors = [
    "write_time"]


for sensor in sensors:
    plot_summaries_heatmap(sensor, "maxmin11FebWritetime")
so for plot I have added ,y_axis_type='datetime'
but I see only years an they are not fit well the graph:
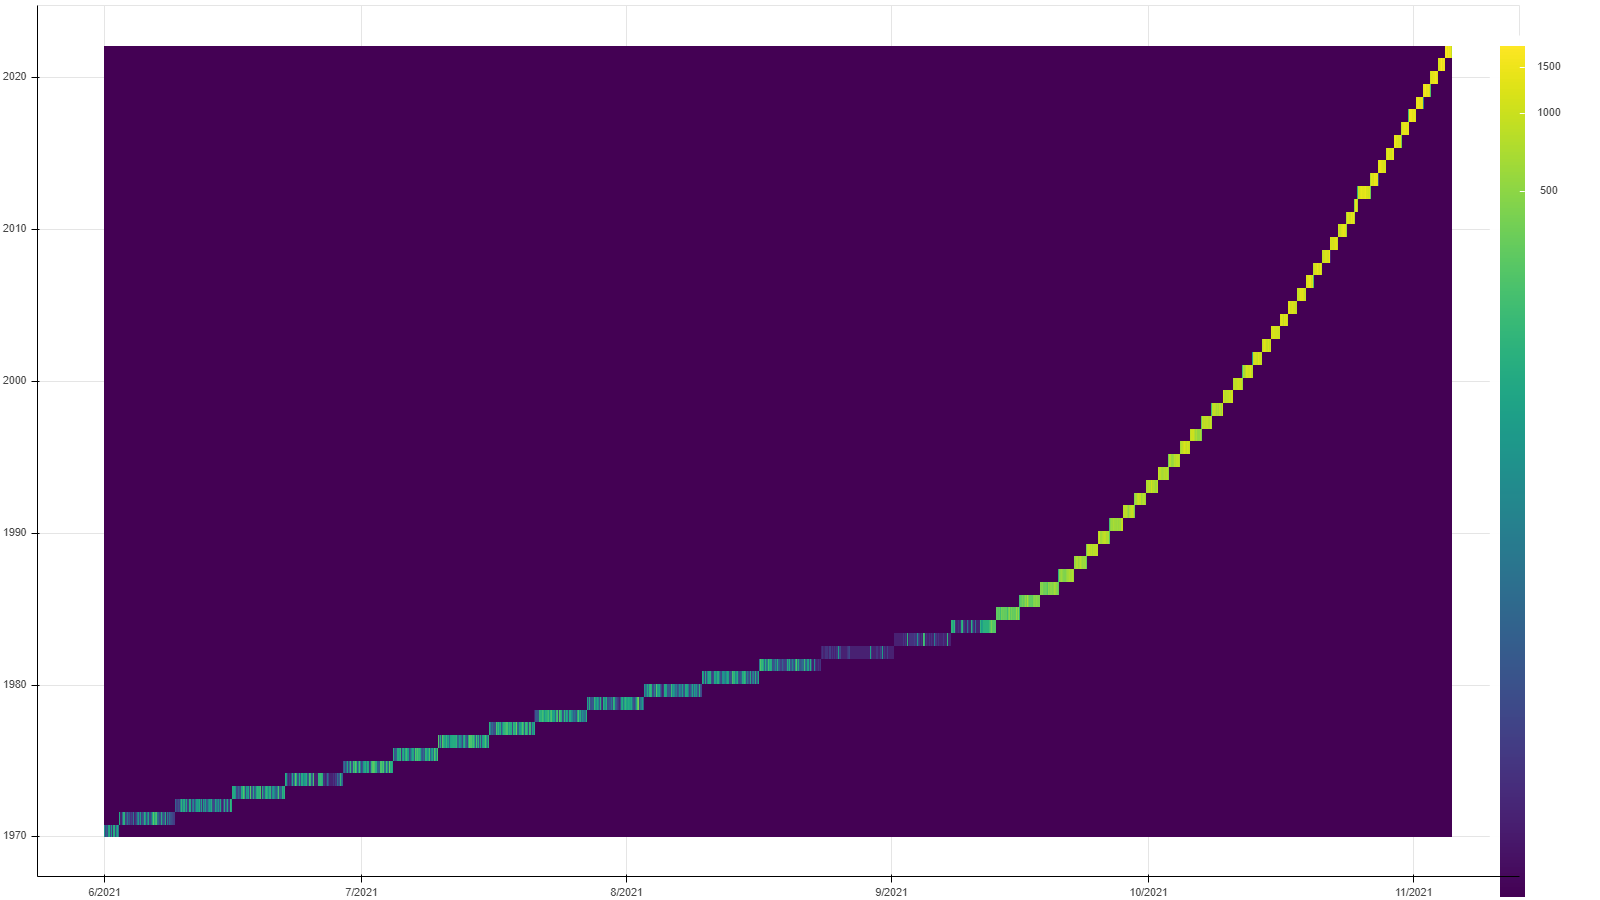
Actually, the y axis vales should be different hours within one day (today)
UPD:
the data that is comes throu numpy.pivot() is
+-------------------+-------------------+-----+
|write_time         |window_time        |count|
+-------------------+-------------------+-----+
|2022-02-17 18:00:00|2021-11-05 12:00:00|1    |
|2022-02-17 18:00:00|2021-11-05 11:50:00|208  |
|2022-02-17 18:00:00|2021-11-05 11:40:00|213  |
|2022-02-17 18:00:00|2021-11-05 11:30:00|198  |
|2022-02-17 18:00:00|2021-11-05 11:20:00|192  |
|2022-02-17 18:00:00|2021-11-05 11:10:00|212  |
|2022-02-17 18:00:00|2021-11-05 11:00:00|274  |
|2022-02-17 18:00:00|2021-11-05 10:50:00|1592 |
|2022-02-17 18:00:00|2021-11-05 10:40:00|1614 |
|2022-02-17 18:00:00|2021-11-05 10:30:00|1549 |
|2022-02-17 18:00:00|2021-11-05 10:20:00|1440 |
|2022-02-17 18:00:00|2021-11-05 10:10:00|1449 |
|2022-02-17 18:00:00|2021-11-05 10:00:00|1404 |
|2022-02-17 18:00:00|2021-11-05 09:50:00|1342 |
count forms the 2d array, while both timestamp values form axis
with plain number in Y I have no problem