Hello guys,
I need your assistance because I don’t understand how to modify the curves of my figure by changing values in select buttons.
I want to represent the values of the column ‘prod’ by selecting some values in the columns scenario, algo and t in 3 independent select widget buttons.
I have the dataframe containing the columns of time t, scenario scenario, algorithm algo, step k and the production prod.
The columns t, k and prod are float values.
The column scenario has 2 unique values ‘scen1’, ‘scen2’.
The column algo has 2 unique values ‘algo1’ and ‘algo2’.
Here the example of dataframe
dico = {'scenario':['scen1', 'scen1', 'scen1', 'scen1','scen1','scen1',
                    'scen1', 'scen1', 'scen2', 'scen2', 'scen2', 'scen2'],
	'algo' :['algo1','algo1','algo1','algo1','algo2','algo2','algo2',
              'algo2','algo1','algo1','algo1','algo1'],
	't' :[0,0,1,1,0,0,1,1,0,0,1,1],
	'k' :[0,1,0,1,0,1,0,1,0,1,0,1],
	'prod':np.random.rand(12)
}
df = pd.DataFrame(dico, columns=['scenario','algo','t','k','prod'])
by selecting a scenario, algorithm and time value, I sum up all productions with a value of k={0,1} using groupby.
The figure becomes unreadable because it contains several curves.
df_sc_al_t = df[(df.scenario == scenario) & (df.algo == algo) & (df.t == t)]
df_sc_al_t_k = df_sc_al_t.groupby("k")["prod"].aggregate(np.sum).reset_index()
df_sc_al_t_k["scenario"] = scenario
df_sc_al_t_k["algo"] = algo
df_sc_al_t_k["t"] = t
source = ColumnDataSource(data = df_sc_al_t_k)
I want to select the value of the scenario, the algorithm and the time in independent select and checkbox widget buttons and then display only their curves in the figure.
I don’t understand how changing the scenario, algorithm and time values can affect the groupby made with “k”.
this is an image of what i expected:
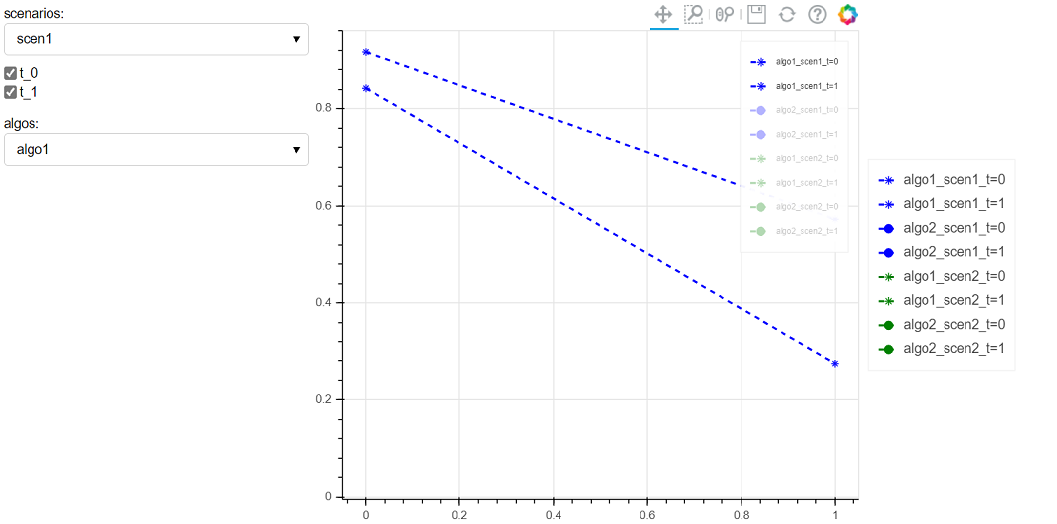
Here is a very short example of my problem and an image representing what I want to do.
import numpy as np
import pandas as pd
import itertools as it

from bokeh.models import ColumnDataSource
from bokeh.plotting import figure, show
from bokeh.layouts import row, column
from bokeh.models import  Legend, Select, CheckboxGroup


COLORS = ["orange", "blue", "green", "pink", "red"]

dico = {'scenario':['scen1', 'scen1', 'scen1', 'scen1','scen1','scen1',
                    'scen1', 'scen1', 'scen2', 'scen2', 'scen2', 'scen2'],
	'algo' :['algo1','algo1','algo1','algo1','algo2','algo2','algo2',
              'algo2','algo1','algo1','algo1','algo1'],
	't' :[0,0,1,1,0,0,1,1,0,0,1,1],
	'k' :[0,1,0,1,0,1,0,1,0,1,0,1],
	'prod':np.random.rand(12)
}
df = pd.DataFrame(dico, columns=['scenario','algo','t','k','prod'])

scenarios = df["scenario"].unique()
algos = df["algo"].unique()
times = df["t"].unique()

px = figure(plot_height = int(500),
                plot_width = int(700),
                toolbar_location="above")
tup_legends = []
for scenario, algo, t in it.product(scenarios, algos, times):
    df_sc_al_t = df[(df.scenario == scenario) & (df.algo == algo) & (df.t == t)]

    df_sc_al_t_k = df_sc_al_t.groupby("k")["prod"].aggregate(np.sum).reset_index()

    df_sc_al_t_k["scenario"] = scenario
    df_sc_al_t_k["algo"] = algo
    df_sc_al_t_k["t"] = t
    source = ColumnDataSource(data = df_sc_al_t_k)

    ind_color = 0
    if scenario == "scen1":
        ind_color = 1
    elif scenario == "scen2":
        ind_color = 2
    elif scenario == "scen3":
        ind_color = 3

    ylabel = "prod"
    label = "{}_{}_t={}".format(algo, scenario, t)
    r1 = px.line(x="k", y=ylabel, source=source, legend_label=label,
            line_width=2, color=COLORS[ind_color],
            line_dash=[5,5])


    if algo == "algo1":
        r2 = px.asterisk(x="k", y=ylabel, size=7, source=source,
                    color=COLORS[ind_color], legend_label=label)
        tup_legends.append((label, [r1,r2] ))
        # tup_legends.append((label, [r2] ))
    elif algo == "algo2":
        r2 = px.circle(x="k", y=ylabel, size=7, source=source,
                  color=COLORS[ind_color], legend_label=label)
        tup_legends.append((label, [r1,r2] ))

legend = Legend(items= tup_legends, location="center")
px.legend.label_text_font_size = "8px"
px.legend.click_policy="hide"
px.add_layout(legend, 'right')


select_scenario = Select(title="scenarios:",
                         value=list(scenarios)[0], options=list(scenarios))

times = list(map(lambda x: 't_'+str(x), times))
select_t = CheckboxGroup(labels=times, active=[0, 1])

select_algo = Select(title="algos:",
                         value=list(algos)[0], options=list(algos))

col_select = column(select_scenario,  select_algo, select_t)
row_px_select = row(col_select, px)

show(row_px_select)