Hi to all
I want to use the 3d vis.js lib for showing position related data.
All my other data are organized into a tabframe and the vis.js plot shall also be in the tabframe.
I followed an example from this blog to insert the vis.js plot to the tabframe structure, see code below.
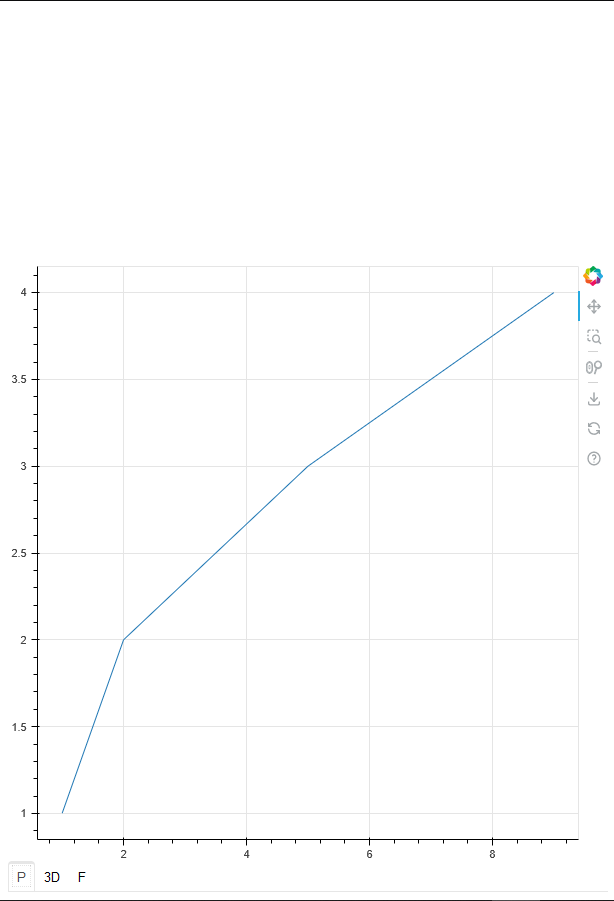
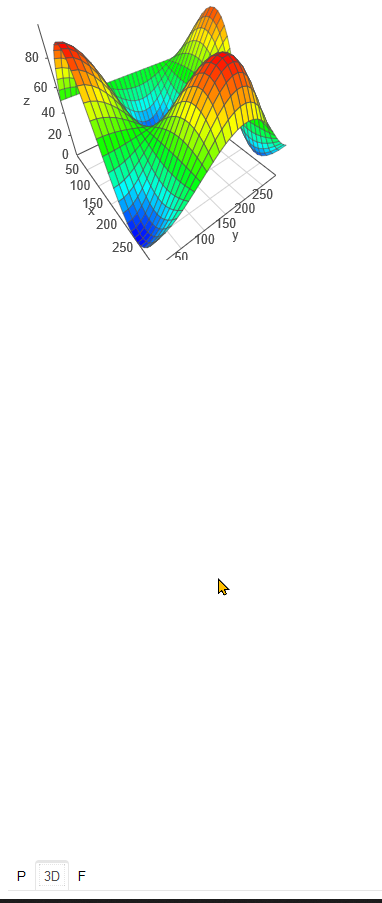
Unfortunately the vis.js plot is set outside of the tabframe, see screenshots below.
The other bokeh plots are placed correctly.
Additionally the tab selectors are placed to the wrong side of tabframe, here bottom instead of top.
This occur with the browsers firefox, chrome and edge.
How to integrate the vis.js plot to the tabframe correctly?
Do i need to add some extra HTML/CSS/JS?
Setup is Win10, Python3.11, Bokeh3.1. I’m with Python but not with JS and HTML.
Thank you.
Andreas
import numpy as np

from bokeh.core.properties import Instance, String
from bokeh.io import show
from bokeh.models import ColumnDataSource, LayoutDOM, Tabs, TabPanel
from bokeh.util.compiler import TypeScript
from bokeh.plotting import figure, show


CODE = """
// This custom model wraps one part of the third-party vis.js library:
//
//     http://visjs.org/index.html
//
// Making it easy to hook up python data analytics tools (NumPy, SciPy,
// Pandas, etc.) to web presentations using the Bokeh server.

import {LayoutDOM, LayoutDOMView} from "models/layouts/layout_dom"
import {ColumnDataSource} from "models/sources/column_data_source"
import * as p from "core/properties"

declare namespace vis {
  class Graph3d {
    constructor(el: HTMLElement | DocumentFragment, data: object, OPTIONS: object)
    setData(data: vis.DataSet): void
  }

  class DataSet {
    add(data: unknown): void
  }
}

// This defines some default options for the Graph3d feature of vis.js
// See: http://visjs.org/graph3d_examples.html for more details.
const OPTIONS = {
  width: '300px',
  height: '300px',
  style: 'surface',
  showPerspective: true,
  showGrid: true,
  keepAspectRatio: true,
  verticalRatio: 1.0,
  legendLabel: 'stuff',
  cameraPosition: {
    horizontal: -0.35,
    vertical: 0.22,
    distance: 1.8,
  },
}
// To create custom model extensions that will render on to the HTML canvas
// or into the DOM, we must create a View subclass for the model.
//
// In this case we will subclass from the existing BokehJS ``LayoutDOMView``
export class Surface3dView extends LayoutDOMView {
  declare model: Surface3d

  private _graph: vis.Graph3d

  initialize(): void {
    super.initialize()

    const url = "https://cdnjs.cloudflare.com/ajax/libs/vis/4.16.1/vis.min.js"
    const script = document.createElement("script")
    script.onload = () => this._init()
    script.async = false
    script.src = url
    document.head.appendChild(script)
  }

  private _init(): void {
    // Create a new Graph3s using the vis.js API. This assumes the vis.js has
    // already been loaded (e.g. in a custom app template). In the future Bokeh
    // models will be able to specify and load external scripts automatically.
    //
    // BokehJS Views create <div> elements by default, accessible as this.el.
    // Many Bokeh views ignore this default <div>, and instead do things like
    // draw to the HTML canvas. In this case though, we use the <div> to attach
    // a Graph3d to the DOM.
    this._graph = new vis.Graph3d(this.shadow_el, this.get_data(), OPTIONS)

    // Set a listener so that when the Bokeh data source has a change
    // event, we can process the new data
    this.connect(this.model.data_source.change, () => {
      this._graph.setData(this.get_data())
    })
  }

  // This is the callback executed when the Bokeh data has an change. Its basic
  // function is to adapt the Bokeh data source to the vis.js DataSet format.
  get_data(): vis.DataSet {
    const data = new vis.DataSet()
    const source = this.model.data_source
    for (let i = 0; i < source.get_length()!; i++) {
      data.add({
        x: source.data[this.model.x][i],
        y: source.data[this.model.y][i],
        z: source.data[this.model.z][i],
      })
    }
    return data
  }

  get child_models(): LayoutDOM[] {
    return []
  }
}

// We must also create a corresponding JavaScript BokehJS model subclass to
// correspond to the python Bokeh model subclass. In this case, since we want
// an element that can position itself in the DOM according to a Bokeh layout,
// we subclass from ``LayoutDOM``
export namespace Surface3d {
  export type Attrs = p.AttrsOf<Props>

  export type Props = LayoutDOM.Props & {
    x: p.Property<string>
    y: p.Property<string>
    z: p.Property<string>
    data_source: p.Property<ColumnDataSource>
  }
}

export interface Surface3d extends Surface3d.Attrs {}

export class Surface3d extends LayoutDOM {
  declare properties: Surface3d.Props
  declare __view_type__: Surface3dView

  constructor(attrs?: Partial<Surface3d.Attrs>) {
    super(attrs)
  }

  // The ``__name__`` class attribute should generally match exactly the name
  // of the corresponding Python class. Note that if using TypeScript, this
  // will be automatically filled in during compilation, so except in some
  // special cases, this shouldn't be generally included manually, to avoid
  // typos, which would prohibit serialization/deserialization of this model.
  static __name__ = "Surface3d"

  static {
    // This is usually boilerplate. In some cases there may not be a view.
    this.prototype.default_view = Surface3dView

    // The @define block adds corresponding "properties" to the JS model. These
    // should basically line up 1-1 with the Python model class. Most property
    // types have counterparts, e.g. ``bokeh.core.properties.String`` will be
    // ``String`` in the JS implementatin. Where the JS type system is not yet
    // as rich, you can use ``p.Any`` as a "wildcard" property type.
    this.define<Surface3d.Props>(({String, Ref}) => ({
      x:            [ String ],
      y:            [ String ],
      z:            [ String ],
      data_source:  [ Ref(ColumnDataSource) ],
    }))
  }
}
"""

# This custom extension model will have a DOM view that should layout-able in
# Bokeh layouts, so use ``LayoutDOM`` as the base class. If you wanted to create
# a custom tool, you could inherit from ``Tool``, or from ``Glyph`` if you
# wanted to create a custom glyph, etc.
class Surface3d(LayoutDOM):

    # The special class attribute ``__implementation__`` should contain a string
    # of JavaScript code that implements the browser side of the extension model.
    __implementation__ = TypeScript(CODE)

    # Below are all the "properties" for this model. Bokeh properties are
    # class attributes that define the fields (and their types) that can be
    # communicated automatically between Python and the browser. Properties
    # also support type validation. More information about properties in
    # can be found here:
    #
    #    https://docs.bokeh.org/en/latest/docs/reference/core/properties.html#bokeh-core-properties

    # This is a Bokeh ColumnDataSource that can be updated in the Bokeh
    # server by Python code
    data_source = Instance(ColumnDataSource)

    # The vis.js library that we are wrapping expects data for x, y, and z.
    # The data will actually be stored in the ColumnDataSource, but these
    # properties let us specify the *name* of the column that should be
    # used for each field.
    x = String()

    y = String()

    z = String()


x = np.arange(0, 300, 10)
y = np.arange(0, 300, 10)
xx, yy = np.meshgrid(x, y)
xx = xx.ravel()
yy = yy.ravel()
value = np.sin(xx / 50) * np.cos(yy / 50) * 50 + 50

source = ColumnDataSource(data=dict(x=xx, y=yy, z=value))

surface = Surface3d(x="x", y="y", z="z", data_source=source, width=600, height=600)

#show(surface)

f    = figure()
f.line([1,2,3,4],[1,2,5,9])

p    = figure()
p.line([1,2,5,9],[1,2,3,4])

t1   = TabPanel(child=p,title='P')
t2   = TabPanel(child=surface,title='3D')
t3   = TabPanel(child=f,title='F')

tabs = Tabs(tabs=[t1,t2,t3],tabs_location="above")

show(tabs)