How to plot a range using ColumnDataSource?

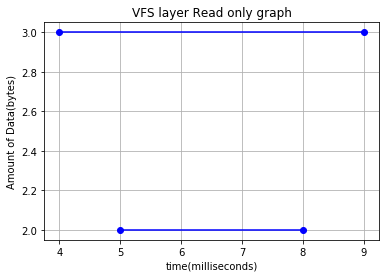
I am trying to plot a big graph. I want to plot a range in X_axis. Below you can find what I am trying to do, which I made using matplotlib.

import matplotlib.pyplot as plt
import csv

with open('test.csv','r') as csvfile :
    rows = list(csv.reader(csvfile, delimiter=','))[1:]
    rows.sort(key = lambda x: int(x[1])) 
    for row in rows:
        start, end, data = int(row[2]), int(row[3]), int(row[1])
        x = [start, end]
        y = [data, data]
        plt.plot(x, y, color = 'b', marker='o')
plt.xlabel('time(milliseconds)')
plt.ylabel('Amount of Data(bytes)')
plt.title('VFS layer Read only graph')
plt.grid(True)
plt.savefig('VR.png')
plt.show()

image
This is the image result for the plot using matplotlib. I want to do the same using Bokeh ColumnDataSource.

df = pd.read_csv('test.csv')

data = ColumnDataSource(data={
    'x':df['x'],
    **'y':df['y1']+df['y2'],** # I could not give range in here
})
plot1 = figure()
plot1.cross(x='x',y='y',source=data, color='red', size=10, alpha=0.8)
plot2 = figure()
output_file('First_try.html')
show(plot1)

How can I give a range in ColumnDataSource?

Segments should help with that: Plotting with basic glyphs — Bokeh 2.4.2 Documentation
And the circles at the ends of the segments could be plotted with plot.circle.
Regarding the data - just store both y1 and y2 as separate columns in the data source.

1 Like
df = pd.read_csv('test.csv')
print(df)
data = ColumnDataSource(data={
    'x':df['x'],
    'y1':df['y1'],
    'y2':df['y2'],
})
plot1 = figure()
plot1.segment(x0='x', y0='y1', x1='x',y1='y2', color="#F4A582", line_width=3)
output_file('First_try.html')
show(plot1)

I have changed the code as you said, but it is giving error

ERROR:bokeh.core.validation.check:E-1001 (BAD_COLUMN_NAME): Glyph refers to nonexistent column name. This could either be due to a misspelling or typo, or due to an expected column being missing. : key "x0" value "x", key "x1" value "x", key "y0" value "y1", key "y1" value "y2" [renderer: GlyphRenderer(id='6297', ...)]

This is the csv file :
id x y1 y2
0 1 2 5 8
1 2 3 4 9

Sorry, I forgot to put the source :

df = pd.read_csv('test.csv')
print(df)
data = ColumnDataSource(data={
    'x1':df['x1'],
    'x2':df['x2'],
    'y':df['y'],
})
plot1 = figure(plot_width=400, plot_height=400)
plot1.segment(x0='x1', y0='y', x1='x2',y1='y', color="red", line_width=3,**source=data**)
output_file('First_try.html')
show(plot1)


This is the result of plot using plot1.circle, but plot1.segment is not printing anything.

df = pd.read_csv('syscall.csv')
print(df)
data = ColumnDataSource(data={
    'x1':df['subm_syscall_ts'],
    'x2':df['comp_syscall_ts'],
    'y':df['lat'],
})
plot1 = figure()
plot1.segment(x0='x1',y0='y',x1='x2',y1='y',source=data, color='red',alpha=1)
plot1.circle(x='x1',y='y',color='green',size=5,source=data)
output_file('segment.html')
show(plot1)

The syscall.csv contains 218k lines of information regarding input/output of ssd(solid state drive). Why plot1.segment is not printing anything?

Most likely either it’s your data or your scale - the segments could be shorter than the size of the circles.
This works just fine:

from bokeh.io import show
from bokeh.models import ColumnDataSource
from bokeh.plotting import figure

data = ColumnDataSource(data={
    'x1': [1, 2, 3],
    'x2': [2, 3, 5],
    'y': [0, 1, 2],
})
p = figure()
p.segment(x0='x1', y0='y', x1='x2', y1='y', source=data, color='red', alpha=1)
p.circle(x='x1', y='y', color='green', size=5, source=data)

show(p)

I think there is a limitation for segment while there isn’t for circle. It is working fine when I executed with 5 lines of information for segment but with 30 lines it is not drawing anythin.

Can you provide a minimal reproducible example? Because for me the above code works just fine even for a hundred segments.

There is no limitation anywhere close to that small. Here is an example that plots 2500 segments:

1 Like

Sorry, it was working fine. The line width was small and the amount of data was too big, that is why the lines were disappearing. It works fine now. Thanks for kind cooperation.

1 Like