After updating the axis ranges of a plot with labels, the labels gets clipped by the egde of the canvas.
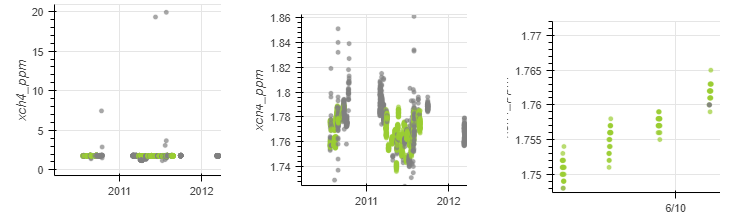
This happens when I zoom in and the precision of the numbers on the axis grows (so the strings get longer and ‘push’ the label in the edge), I attached a picture of the same plot with different zooms.
This also happen when I push new data to a source, but this is fixed when I use the ‘Reset’ button which changes the actual plot area to fit everything.
What should I do to resize the plot area like the Reset button does, but without resetting the axis ranges?
On Thu, Aug 31, 2017 at 6:56 PM, Sébastien Roche [email protected] wrote:
After updating the axis ranges of a plot with labels, the labels gets clipped by the egde of the canvas.
This happens when I zoom in and the precision of the numbers on the axis grows (so the strings get longer and ‘push’ the label in the edge), I attached a picture of the same plot with different zooms.
This also happen when I push new data to a source, but this is fixed when I use the ‘Reset’ button which changes the actual plot area to fit everything.
What should I do to resize the plot area like the Reset button does, but without resetting the axis ranges?
–
You received this message because you are subscribed to the Google Groups “Bokeh Discussion - Public” group.
To unsubscribe from this group and stop receiving emails from it, send an email to [email protected].
For now, workarounds are increasing padding to accommodate any larger labels that might show up as suggested, or rotating the labels to be parallel to the axis (so that they don't expand normal to the axis at all).
Thanks,
Bryan
···
On Aug 31, 2017, at 10:22, Nikoloz Mamisashvili <[email protected]> wrote:
from bokeh.plotting import figure, output_file, show

output_file("border.html")

p = figure(plot_width=400, plot_height=400)
p.border_fill_color = "whitesmoke"
p.min_border_left = 80

p.circle([1,2,3,4,5], [2,5,8,2,7], size=10)

show(p)
<bokeh_plot.png>
May be this will help?
On Thu, Aug 31, 2017 at 6:56 PM, Sébastien Roche <[email protected]> wrote:
After updating the axis ranges of a plot with labels, the labels gets clipped by the egde of the canvas.
This happens when I zoom in and the precision of the numbers on the axis grows (so the strings get longer and 'push' the label in the edge), I attached a picture of the same plot with different zooms.
This also happen when I push new data to a source, but this is fixed when I use the 'Reset' button which changes the actual plot area to fit everything.
What should I do to resize the plot area like the Reset button does, but without resetting the axis ranges?