Hi all,
Is there any way I can avoid generating tooltips that overlap? Or is the way to even stack them instead?
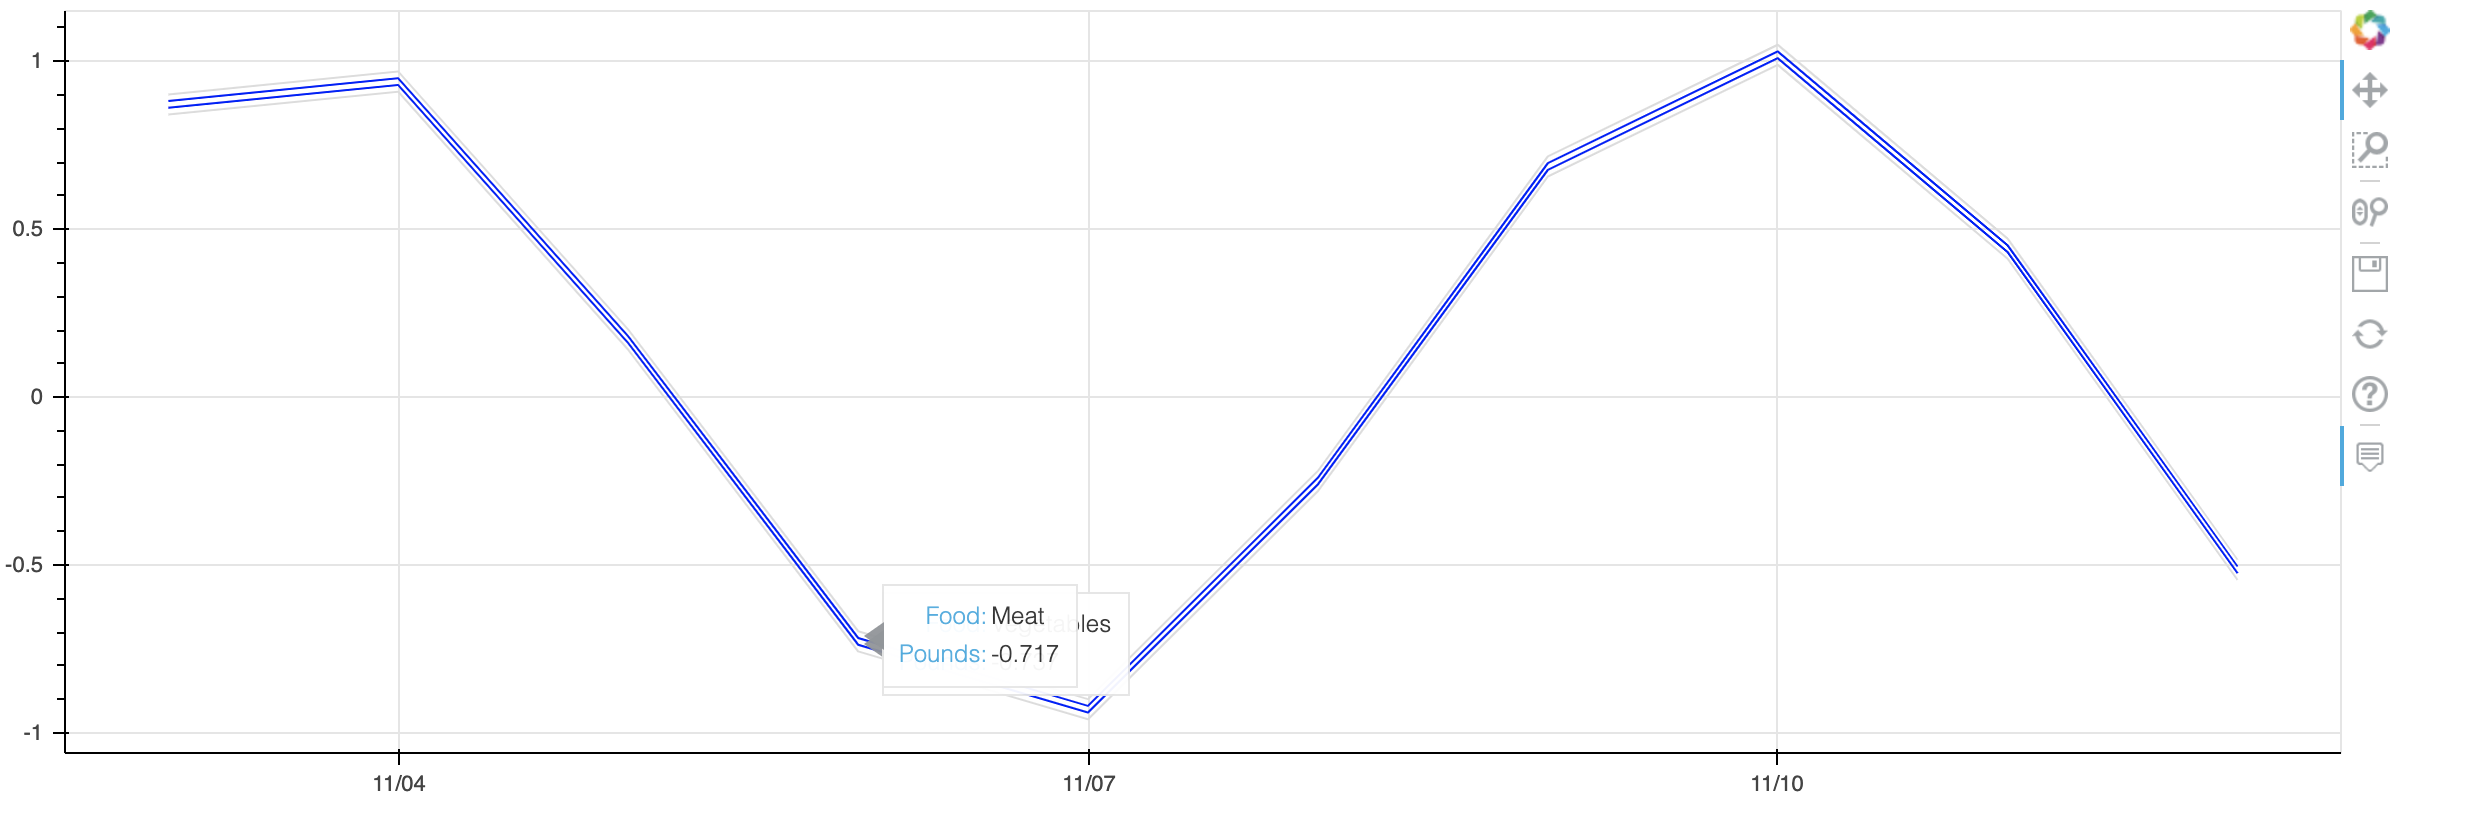
I created a line chart with various lines but the tooltips box are overlapping in some instances.
Here is code that will generate the problem in version 2.2.1
import pandas as pd
import math
from bokeh.plotting import figure, output_file, show
from bokeh.models import ColumnDataSource

# create data frame
fake_vals = [1,2,3,4,5,6,7,8,9,10]
data = {'Fruits': [math.sin(i) for i in fake_vals],
        'Vegetables': [math.sin(i) + .02 for i in fake_vals],
        'Meat': [math.sin(i) + .04 for i in fake_vals],
        'Fish': [math.sin(i) + .06 for i in fake_vals]}
df = pd.DataFrame(data, columns = ['Fruits','Vegetables','Meat','Fish'])

# create x data ranges
x_dates = list(pd.date_range(start = "2009-11-03", end = "2009-11-12"))

# tooltips to use
TOOLTIPS = [("Food", "@food"),('Pounds','@y')]

# figure
p = figure(plot_width=1200, plot_height=400, tooltips = TOOLTIPS,
           x_axis_type = 'datetime')

# glyphs
for s in list(df.columns):
   source = ColumnDataSource(data=dict(
        x = x_dates, y = df[s], food = [s] * df.shape[0]))

   p.line('x','y', color = 'gainsboro', source = source, hover_line_color = 'blue')

output_file("food.html")
show(p)
Attached is a screenshot as well of the problem, you can see the two tooltip boxes overlapping.
Thanks,
Rodrigo