How to retreive coordinates of drawn points

Hi all. I’m building an interactive tool on top of bokeh and it seems like I can’t retreive coordinates of drawn polygons.

Here’s a bit of code that I am using;

from bokeh.plotting import figure, output_file, show
from bokeh.models import PolyDrawTool, PolyEditTool

p = figure(width=400, height=400, title='HumanClassifier')

source = ColumnDataSource(data=df)
p.circle(x='bill_length_mm', y='bill_depth_mm', color='gray', source=source)

p1 = p.patches([], [], fill_color='red', fill_alpha=0.4, line_alpha=0.0)
p2 = p.patches([], [], fill_color='green', fill_alpha=0.4, line_alpha=0.0)
p3 = p.patches([], [], fill_color='blue', fill_alpha=0.4, line_alpha=0.0)
c1 = p.circle([], [], size=5, color='black')

d1 = PolyDrawTool(renderers=[p1])
d1.custom_icon = "red.png"
d2 = PolyDrawTool(renderers=[p2])
d2.custom_icon = "green.png"
d3 = PolyDrawTool(renderers=[p3])
d3.custom_icon = "blue.png"

edit_tool = PolyEditTool(renderers=[p1, p2, p3], vertex_renderer=c1)
p.add_tools(d1, d2, d3, edit_tool)
p.toolbar.active_drag = edit_tool

show(p)

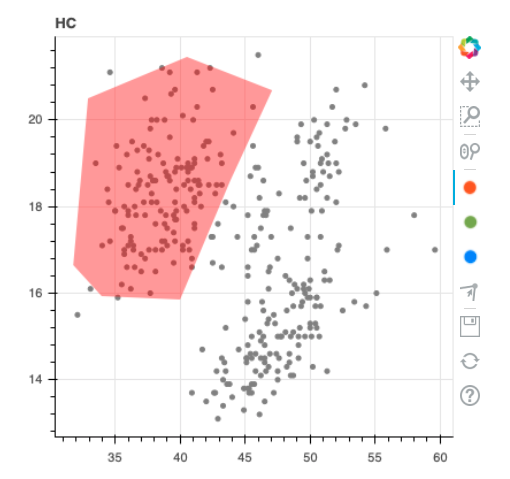
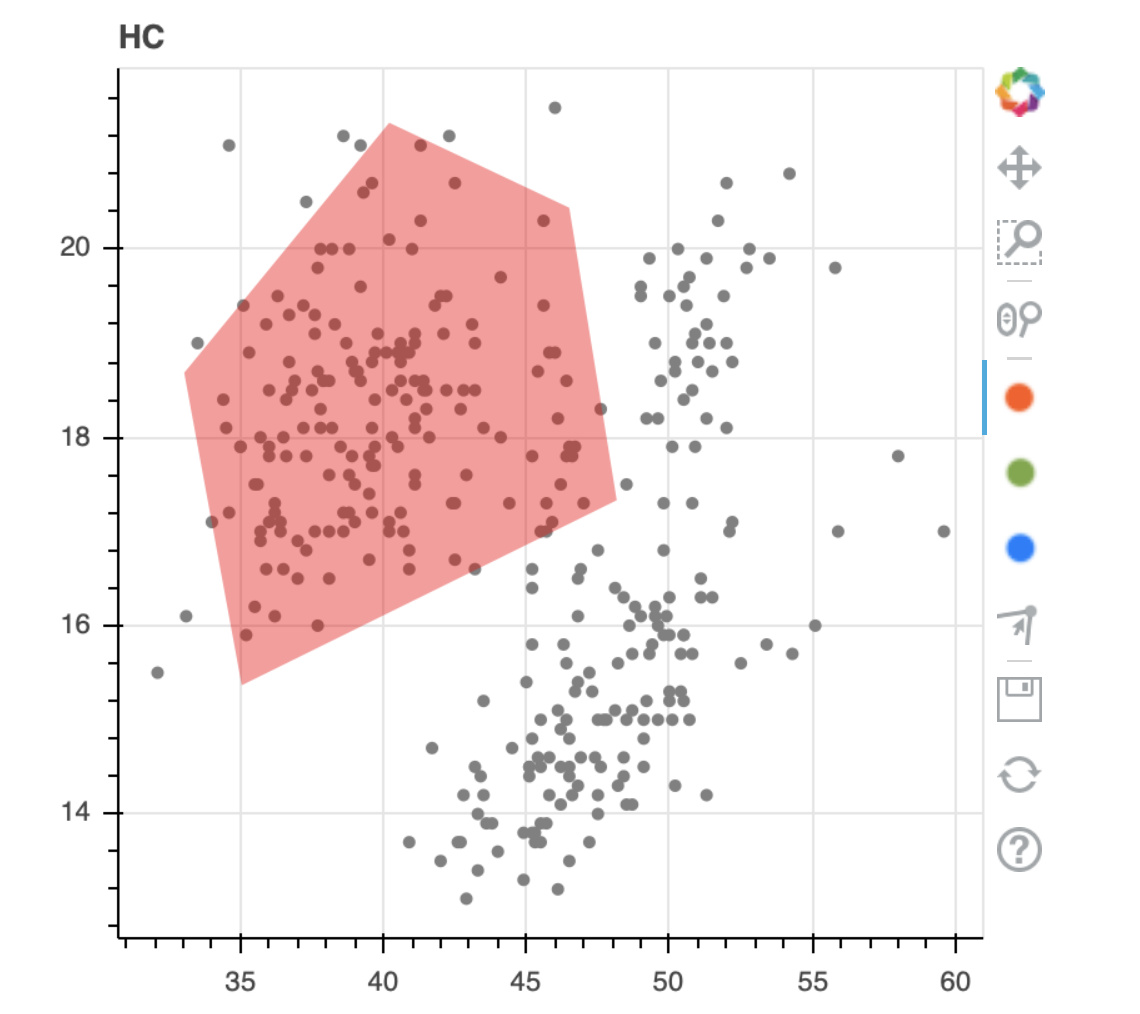
This is what the chart looks like after I’ve drawn a figure in it.

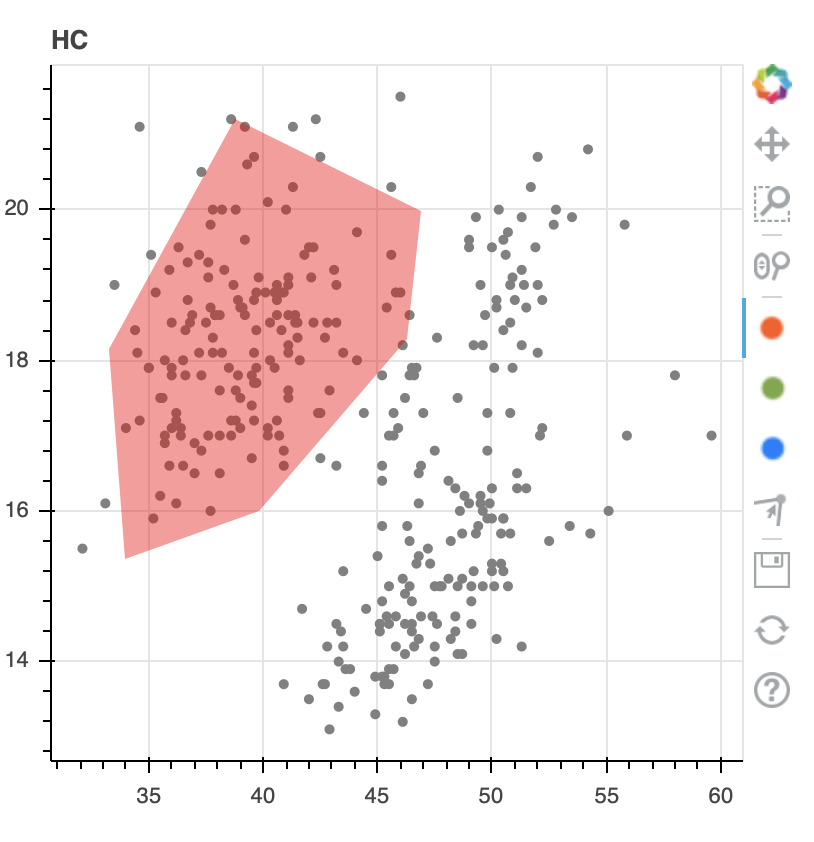
The question now is; how do I get the coordinates of the drawn polygon? I can’t seem to find it anywhere in the documentation.

1 Like

From the documentation of PolyDrawTool:

The PolyDrawTool allows drawing, selecting and deleting Patches and
MultiLine glyphs on one or more renderers by editing the underlying
ColumnDataSource data
.

The italicized emphasis is mine.

Either access p1.data_source to view the implicitly created data source, or create one yourself, pass it to p.patches(), and query its contents.

Thanks for the swift reply @p-himik!

I’ve explored some of this but unfortunately did not get the coordinates. After drawing a red figure like in the picture above I seem to get an empty dataset back.

> p1.data_source.data
{'xs': [], 'ys': []}

I’ll try creating a custom ColumnDataSource.

I’ve created a custom ColumnDataSource and it seems that again it is not receiving any data.

The Code

from bokeh.plotting import figure, output_file, show
from bokeh.models import PolyDrawTool, PolyEditTool

p = figure(width=400, height=400, title='HC')

source = ColumnDataSource(data=df)
p.circle(x='bill_length_mm', y='bill_depth_mm', color='gray', source=source)

source_p1 = ColumnDataSource(data={"xs":[], "ys":[]})
p1 = p.patches("xs", "ys", fill_color='red', fill_alpha=0.4, line_alpha=0.0, source=source_p1)
p2 = p.patches([], [], fill_color='green', fill_alpha=0.4, line_alpha=0.0)
p3 = p.patches([], [], fill_color='blue', fill_alpha=0.4, line_alpha=0.0)
c1 = p.circle([], [], size=5, color='black')

d1 = PolyDrawTool(renderers=[p1])
d1.custom_icon = "red.png"
d2 = PolyDrawTool(renderers=[p2])
d2.custom_icon = "green.png"
d3 = PolyDrawTool(renderers=[p3])
d3.custom_icon = "blue.png"

edit_tool = PolyEditTool(renderers=[p1, p2, p3], vertex_renderer=c1)
p.add_tools(d1, d2, d3, edit_tool)
p.toolbar.active_drag = edit_tool

show(p)

The Chart

image

The Data

It seems empty, like before.

> source_p1.data
{'xs': [], 'ys': []}

I have no idea at what point in time you execute that source_p1.data line. Try this:

from bokeh.layouts import column
from bokeh.models import PolyDrawTool, PolyEditTool, ColumnDataSource, Button, CustomJS
from bokeh.plotting import figure, show

p = figure(x_range=(-1, 1), y_range=(-1, 1))

source_p1 = ColumnDataSource(data={"xs": [], "ys": []})
p1 = p.patches("xs", "ys", fill_color='red', fill_alpha=0.4, line_alpha=0.0, source=source_p1)
c1 = p.circle([], [], size=5, color='black')

d1 = PolyDrawTool(renderers=[p1])

edit_tool = PolyEditTool(renderers=[p1], vertex_renderer=c1)
p.add_tools(d1, edit_tool)
p.toolbar.active_drag = edit_tool

b = Button()

b.js_on_click(CustomJS(args=dict(ds=source_p1),
                       code="console.log(ds.data);"))

show(column(b, p))

Ah, and you execute it in Python. But you’re using show. You don’t see data changes because you generate a static HTML page that doesn’t communicate with the Python side at all. If you need Python Bokeh <-> BokehJS communication, you have to use Bokeh server.

1 Like

Ahhh! That’s probably it. I was wondering what I was missing here. I’ll try that and report back. Thanks!

1 Like

Yep. That was the culprit. Suprisingly easy fix too!

I’ve been able to keep all of this code the same:

from bokeh.plotting import figure, output_file, show
from bokeh.models import PolyDrawTool, PolyEditTool

p = figure(width=400, height=400, title='HC')

source = ColumnDataSource(data=df)
p.circle(x='bill_length_mm', y='bill_depth_mm', color='gray', source=source)

p1 = p.patches([], [], fill_color='red', fill_alpha=0.4, line_alpha=0.0)
p2 = p.patches([], [], fill_color='green', fill_alpha=0.4, line_alpha=0.0)
p3 = p.patches([], [], fill_color='blue', fill_alpha=0.4, line_alpha=0.0)
c1 = p.circle([], [], size=5, color='black')

d1 = PolyDrawTool(renderers=[p1])
d1.custom_icon = "red.png"
d2 = PolyDrawTool(renderers=[p2])
d2.custom_icon = "green.png"
d3 = PolyDrawTool(renderers=[p3])
d3.custom_icon = "blue.png"

edit_tool = PolyEditTool(renderers=[p1, p2, p3], vertex_renderer=c1)
p.add_tools(d1, d2, d3, edit_tool)
p.toolbar.active_drag = edit_tool

The only code that changed was this:

def app(doc):
    global p
    doc.add_root(p)

show(app)

After drawing this image;

I now get what I want.

> p1.data_source.data
{'xs': [[40.202167096441194,
   33.03309195193252,
   35.04393010222154,
   48.158091951932526,
   46.49696478430247]],
 'ys': [[21.341172332763673,
   18.68599991897057,
   15.367034401729189,
   17.331861987936087,
   20.438413712074016]]}

@p-himik thanks again!

2 Likes