I need to plot HeatMap (based on rect). Now, the y order is not correct since it starts from 10.
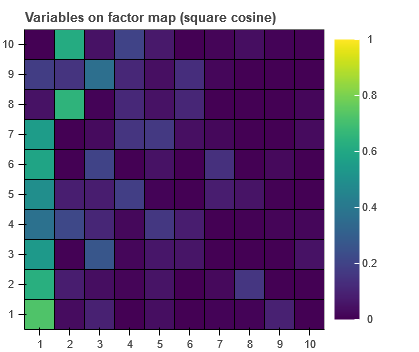
I need to plot HeatMap (based on rect). Now, the y order is not correct since it starts from 10.
You can flip the Y axis values, does this help?
plot=figure()
plot.y_range.flipped = True
Unfortunately doesn’t work for categorical var.
unexpected attribute ‘flipped’ to FactorRange
Just guessing because I don’t know what you have to produce the plot but how about this:
p = figure(y_range=list(reversed(data.columns)))
50% success. Y axis is reversed but no data changed.
Concerning data structure:
I don’t use pandas, data are taken from numpy arrays and form CDS. Suppose the raw data could be:
x_names = [‘PC1’, ‘PC2’, ‘PC3’]
y_names = [‘var A’, ‘var B’, ‘var C’]
Z = np.array([-10,-10,-10,0,0,0,10,10,10])
@grzegorz.malinowski changing the order of the factors configured on the range as @carl suggests is the way to change the order on the axis, as described here:
Handling categorical data — Bokeh 2.4.2 Documentation
If you are seeing something different, then you really need to provide a complete, minimal example of your code so that is possible to see what is actually going on.
I’m a bit skeptical whether it’s a solution since we have 2D array, that must be flattened to match CDS tabular data format. But of course, let’s try. I’m providing you with the code. Y axis is in its ‘original’ position. Should be reversed, same applies to data.
from bokeh.io import output_notebook, output_file, show
from bokeh.models import FactorRange, ColumnDataSource, LinearColorMapper, ColorBar
from bokeh.plotting import figure
from bokeh.palettes import Viridis
output_notebook()
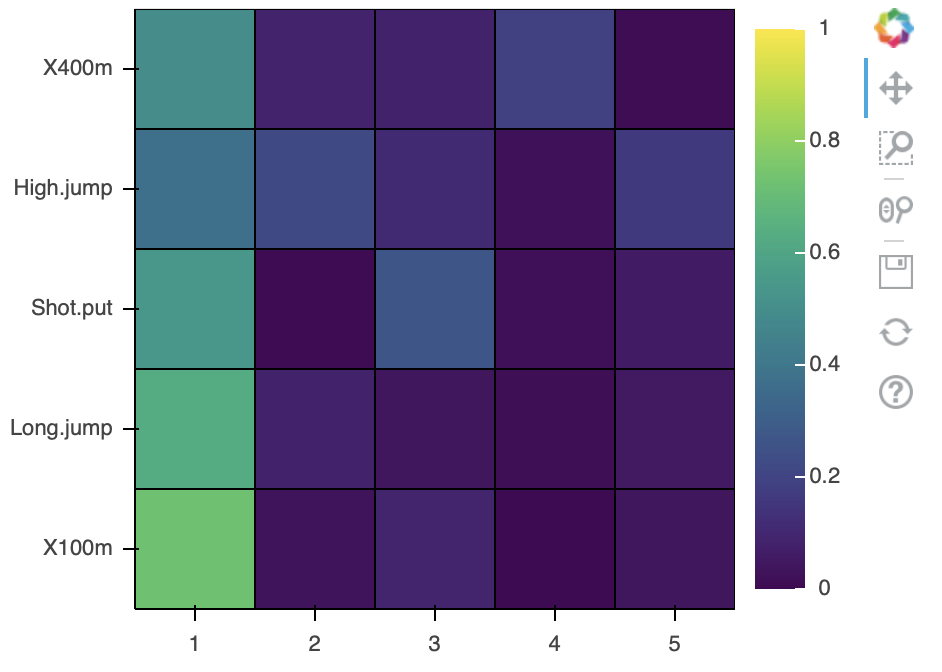
data = np.array([[0.7236, 0.0322, 0.0909, 0.0011, 0.0378],
[0.6307, 0.0789, 0.0363, 0.0133, 0.0544],
[0.5386, 0.0073, 0.2679, 0.0165, 0.0619],
[0.3722, 0.2164, 0.109 , 0.0209, 0.1622],
[0.4922, 0.0842, 0.0804, 0.1856, 0.0108]])
p = 5
X_names = ['1','2','3','4','5']
Y_names = ['X100m', 'Long.jump', 'Shot.put', 'High.jump', 'X400m']
x_cat_range = FactorRange(factors=X_names, range_padding=0, bounds=(0, p))
y_cat_range = FactorRange(factors=Y_names, range_padding=0, bounds=(0, p))
mapper = LinearColorMapper(Viridis[256], low=0, high=1)
data_m = {'X': np.tile(X_names, p),
'Y': np.repeat(Y_names, p),
'XY_values': data.flatten()}
source = ColumnDataSource(data=data_m)
p = figure(x_range=x_cat_range, y_range=y_cat_range,
frame_height=300, frame_width=300, match_aspect=True,)
p.rect(x='X', y='Y', source=source, width=1, height=1,
fill_color={'field': 'XY_values', 'transform': mapper},
line_color='black')
color_bar = ColorBar(color_mapper=mapper, location=(0, 0))
p.add_layout(color_bar, 'right')
show(p)@grzegorz.malinowski The coordinate systems are orthogonal and independent, so it’s certainly possible to flip one independently of the other. Running and your code and updating the range behaves exactly as exptected / intended:
original
x_cat_range = FactorRange(factors=X_names, ...)
y_cat_range = FactorRange(factors=Y_names, ...)
x-range flipped
x_cat_range = FactorRange(factors=list(reversed(X_names)), ...)
y_cat_range = FactorRange(factors=Y_names, ...)
both rages flipped
x_cat_range = FactorRange(factors=list(reversed(X_names)), ...)
y_cat_range = FactorRange(factors=list(reversed(Y_names)), ...)
Are you asking about something different? Or are you saying these changes don’t produce these results for you?