For the time being, you will need to supply an explicit range yourself that starts and ends where you want:
plot = line(x,y, x_range=(10,0))
There is not currently any way to have an "auto range" that has the direction reversed from the normal sense.
To clarify why what you tried did not work, x and y are just data coordinates, they have no intrinsic relation to the plot range. In the general case, x and y would not be monotonic sequences, so in general there is no way to infer a range direction just from them. The range direction has to be stipulated by the user according to what they want.
Bryan
···
On Oct 29, 2014, at 10:03 AM, HR Gartenbauer <[email protected]> wrote:
I need a line to be plotted from high to low values on the x axis.
from bokeh.plotting import line
import numpy as np
x = np.arange(0,10)
y = np.range(0,10)
plot = line(x,y)
Produces a line plot as expected.
But I need the values to be plotted from 9 to 0, from left to right, on the X axis.
If I do this:
x = np.arange(9,-1,-1)
y = np.arange(9,-1,-1)
plot = line(x,y)
The data is still plotted in increasing order on the x axis.
The plot is identical to the first example.
Thanks Bryan, that works.
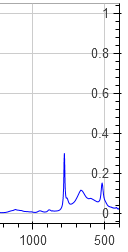
However specifying x_range to reverse the x axis has a side effect.
The y axis ticks are now placed on the right side of the plot, and are internal to the plot, that is the tick marks and labels are on the right side and are drawn inside the plot box.
So not only is the x axis reversed, the y axis tick marks are automatically placed at the low-value end of the x axis (the right side).
I’ve attached a screen shot.
···
On Wednesday, October 29, 2014 10:44:26 AM UTC-5, Bryan Van de ven wrote:
For the time being, you will need to supply an explicit range yourself that starts and ends where you want:
plot = line(x,y, x_range=(10,0))
There is not currently any way to have an “auto range” that has the direction reversed from the normal sense.
To clarify why what you tried did not work, x and y are just data coordinates, they have no intrinsic relation to the plot range. In the general case, x and y would not be monotonic sequences, so in general there is no way to infer a range direction just from them. The range direction has to be stipulated by the user according to what they want.
Bryan
On Oct 29, 2014, at 10:03 AM, HR Gartenbauer [email protected] wrote:
I need a line to be plotted from high to low values on the x axis.
from bokeh.plotting import line
import numpy as np
x = np.arange(0,10)
y = np.range(0,10)
plot = line(x,y)
Produces a line plot as expected.
But I need the values to be plotted from 9 to 0, from left to right, on the X axis.
If I do this:
x = np.arange(9,-1,-1)
y = np.arange(9,-1,-1)
plot = line(x,y)
The data is still plotted in increasing order on the x axis.
The plot is identical to the first example.
How can I reverse the X axis direction?
Thanks…
–
You received this message because you are subscribed to the Google Groups “Bokeh Discussion - Public” group.
To unsubscribe from this group and stop receiving emails from it, send an email to [email protected].
For now you would have to build Bokeh from the source to pick up this fix, but we should have a dev build available for users towards the end of the week, and the 0.7 release will be in mid-November (with a release candidate before then).
Bryan
···
On Oct 29, 2014, at 11:44 AM, HR Gartenbauer <[email protected]> wrote:
Thanks Bryan, that works.
However specifying x_range to reverse the x axis has a side effect.
The y axis ticks are now placed on the right side of the plot, and are internal to the plot, that is the tick marks and labels are on the right side and are drawn inside the plot box.
So not only is the x axis reversed, the y axis tick marks are automatically placed at the low-value end of the x axis (the right side).
I've attached a screen shot.
On Wednesday, October 29, 2014 10:44:26 AM UTC-5, Bryan Van de ven wrote:
For the time being, you will need to supply an explicit range yourself that starts and ends where you want:
plot = line(x,y, x_range=(10,0))
There is not currently any way to have an "auto range" that has the direction reversed from the normal sense.
To clarify why what you tried did not work, x and y are just data coordinates, they have no intrinsic relation to the plot range. In the general case, x and y would not be monotonic sequences, so in general there is no way to infer a range direction just from them. The range direction has to be stipulated by the user according to what they want.
Bryan
> On Oct 29, 2014, at 10:03 AM, HR Gartenbauer <[email protected]> wrote:
>
>
> I need a line to be plotted from high to low values on the x axis.
>
> from bokeh.plotting import line
> import numpy as np
>
> x = np.arange(0,10)
> y = np.range(0,10)
> plot = line(x,y)
>
> Produces a line plot as expected.
> But I need the values to be plotted from 9 to 0, from left to right, on the X axis.
>
> If I do this:
>
> x = np.arange(9,-1,-1)
> y = np.arange(9,-1,-1)
> plot = line(x,y)
>
> The data is still plotted in increasing order on the x axis.
> The plot is identical to the first example.
>
> How can I reverse the X axis direction?
>
> Thanks...
>
> --
> You received this message because you are subscribed to the Google Groups "Bokeh Discussion - Public" group.
> To unsubscribe from this group and stop receiving emails from it, send an email to bokeh+un...@continuum.io.
> To post to this group, send email to bo...@continuum.io.
> To view this discussion on the web visit https://groups.google.com/a/continuum.io/d/msgid/bokeh/fc4c6b86-2196-4484-ae8e-940665c933c2%40continuum.io\.
> For more options, visit https://groups.google.com/a/continuum.io/d/optout\.
For now you would have to build Bokeh from the source to pick up this fix, but we should have a dev build available for users towards the end of the week, and the 0.7 release will be in mid-November (with a release candidate before then).
Bryan
On Oct 29, 2014, at 11:44 AM, HR Gartenbauer [email protected] wrote:
Thanks Bryan, that works.
However specifying x_range to reverse the x axis has a side effect.
The y axis ticks are now placed on the right side of the plot, and are internal to the plot, that is the tick marks and labels are on the right side and are drawn inside the plot box.
So not only is the x axis reversed, the y axis tick marks are automatically placed at the low-value end of the x axis (the right side).
I’ve attached a screen shot.
On Wednesday, October 29, 2014 10:44:26 AM UTC-5, Bryan Van de ven wrote:
For the time being, you will need to supply an explicit range yourself that starts and ends where you want:
plot = line(x,y, x_range=(10,0))
There is not currently any way to have an “auto range” that has the direction reversed from the normal sense.
To clarify why what you tried did not work, x and y are just data coordinates, they have no intrinsic relation to the plot range. In the general case, x and y would not be monotonic sequences, so in general there is no way to infer a range direction just from them. The range direction has to be stipulated by the user according to what they want.
Bryan
On Oct 29, 2014, at 10:03 AM, HR Gartenbauer [email protected] wrote:
I need a line to be plotted from high to low values on the x axis.
from bokeh.plotting import line
import numpy as np
x = np.arange(0,10)
y = np.range(0,10)
plot = line(x,y)
Produces a line plot as expected.
But I need the values to be plotted from 9 to 0, from left to right, on the X axis.
If I do this:
x = np.arange(9,-1,-1)
y = np.arange(9,-1,-1)
plot = line(x,y)
The data is still plotted in increasing order on the x axis.
The plot is identical to the first example.