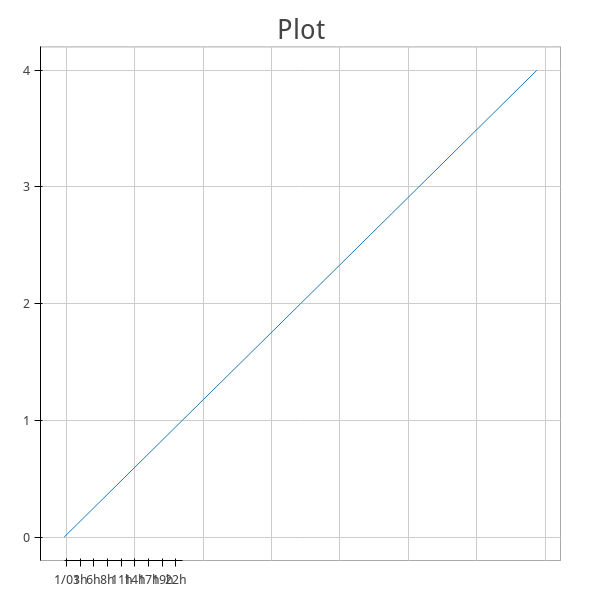
Thanks, that worked for me too. I somehow can't get it to work with 'datetime' xaxis though. Would one still use a Range1d object or something else?
Example,
from bokeh.plotting import *
from bokeh.objects import Range1d
from datetime import datetime, timedelta
import numpy as np
output_file('test.html')
dates = [datetime(2013,1,1) + timedelta(x) for x in range(5)]
plot_dates = [np.datetime64(x).astype(long)/1000 for x in dates]
line(plot_dates, range(5), x_axis_type='datetime')
curplot().xrange = Range1d(start=plot_dates[0], end=plot_dates[1]) # here
xaxis().bounds = (plot_dates[0], plot_dates[1])
show()
On Tue, Dec 10, 2013 at 2:19 PM, Bryan Van de Ven <[email protected]> wrote:
Mathis,
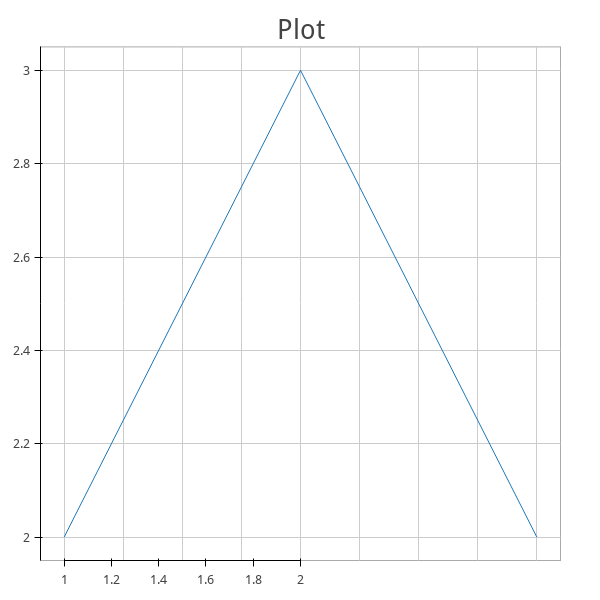
Ah yes that is a different question, the axes bounds limit the extents to which the axes will draw. You are asking how to restrict the range of the plot. Right now it's a bit clunky, you have to set the x_range attribute of the plot to a Range1D object (these objects will not auto-size to the extents of the data like the DataRange1d will). This code does what you want I believe.
    from bokeh.plotting import *

    from bokeh.objects import Range1d


    output_file('test.html')


    hold()


    line([1,2,3],[2,3,2])
plot = curplot()
    plot.x_range = Range1d(start=1, end=2)

    xaxis().bounds = [1, 2]


    line([1,2,3],[2,3,2]) # get an error if there is not another renderer


    show()
However I discovered a bug, the plot runs into an error if there is not a second renderer after the range is changed (see the commented line above). I have created a GH issue you can follow if you are interested:
https://github.com/ContinuumIO/bokeh/issues/240
Bryan
On Dec 10, 2013, at 4:17 AM, Mathis Antony <[email protected]> wrote:
> Thanks for the quick reply, below is an example with image
>
> from bokeh.plotting import *
> output_file('test.html')
> line([1,2,3],[2,3,2])
> xaxis().bounds = [1, 2]
> show()
>
> Ticks are constraint to [1, 2] but the axis limits are still [1, 3].
>
> If this is the expected behavior then maybe I should rephrase my question to, "how do I rescale the figure such that the x-axis only runs from 1 to 2 in the above example?"
>
> best, Mathis
>
> On Tue, Dec 10, 2013 at 5:23 AM, Bryan Van de Ven <[email protected]> wrote:
> Maybe I should add, there is also a plot outline property, maybe this is what is persisting that you are wondering about? You can use, for instance:
>
> plot = scatter(
> flowers["petal_length"], flowers["petal_width"], color=flowers["color"],
> fill_alpha=0.2, radius=5, name="iris"
> )
> plot.outline_line_color = None
> xaxis().bounds = [1, 7]
>
> to get rid of the plot outline.
>
> Bryan
>
> On Dec 9, 2013, at 11:19 PM, Bryan Van de Ven <[email protected]> wrote:
>
> > Hi Mathis,
> >
> > Setting xaxis().bounds is the correct way to do it. I just tried adding a line
> >
> > xaxis.bounds() = [1,7]
> >
> > to examples/plotting/iris.py before the show() call, and it behaved as expected. (Axis and ticks constrained to [1,7]) Can you post a complete code sample perhaps with an image showing the problem?
> >
> > Thanks,
> >
> > Bryan
> >
> > On Dec 9, 2013, at 8:26 AM, Mathis <[email protected]> wrote:
> >
> >> What's the bokeh way of setting axis limits? I. e. the most similar method to http://matplotlib.org/api/pyplot_api.html#matplotlib.pyplot.xlim in bokeh.
> >>
> >> If I write xaxis().bounds = (3, 7) , followed by show(), then only the tick label disappear outside (3, 7).
> >> If I write curplot().x_range = Range1d(start=-10, end=10) , followed by show(), then I see no plot but the following in the js console in chrome
> >>
> >> fc8f9ac6-5fc9-47a5-8674-5a51741d1215 PlotContext bb5abbdb-7d2b-49d8-82cb-5e6dd1836f76 test.html:5406
> >> calling require tool/box_select_tool test.html:5393
> >> calling require renderer/guide/grid test.html:5393
> >> calling require tool/preview_save_tool test.html:5393
> >> calling require tool/zoom_tool test.html:5393
> >> calling require tool/resize_tool test.html:5393
> >> calling require source/column_data_source test.html:5393
> >> calling require renderer/annotation/legend test.html:5393
> >> calling require renderer/glyph/glyph_factory test.html:5393
> >> calling require renderer/guide/linear_axis test.html:5393
> >> calling require tool/pan_tool test.html:5393
> >> calling require range/data_range1d test.html:5393
> >> calling require common/plot_context test.html:5393
> >> calling require common/plot test.html:5393
> >> calling require renderer/overlay/box_selection test.html:5393
> >> calling require range/range1d test.html:5393
> >> error with binder
> >> i
> >> • _changing: false
> >> • _events: Object
> >> • _pending: false
> >> • _previousAttributes: Object
> >> • attributes: Object
> >> • changed: Object
> >> • cid: "c-DA14DC8E7F56464580679E2F5C6A292A"
> >> • convert_to_ref: function (){return t.apply(e,arguments)}
> >> • eventers: Object
> >> • get_obj: function (){return t.apply(e,arguments)}
> >> • id: "0441311F3F2B406E82FF2A7624C41E7C"
> >> • inited: true
> >> • properties: Object
> >> • property_cache: Object
> >> • resolve_ref: function (){return t.apply(e,arguments)}
> >> • rpc: function (){return t.apply(e,arguments)}
> >> • __proto__: s
> >> change:start test.html:5382
> >> error with binder
> >> i
> >> • _changing: false
> >> • _events: Object
> >> • _pending: false
> >> • _previousAttributes: Object
> >> • attributes: Object
> >> • changed: Object
> >> • cid: "c-DA14DC8E7F56464580679E2F5C6A292A"
> >> • convert_to_ref: function (){return t.apply(e,arguments)}
> >> • eventers: Object
> >> • get_obj: function (){return t.apply(e,arguments)}
> >> • id: "0441311F3F2B406E82FF2A7624C41E7C"
> >> • inited: true
> >> • properties: Object
> >> • property_cache: Object
> >> • resolve_ref: function (){return t.apply(e,arguments)}
> >> • rpc: function (){return t.apply(e,arguments)}
> >> • __proto__: s
> >> change:end test.html:5382
> >> error on model of
> >> e
> >> • _changing: false
> >> • _events: Object
> >> • _pending: false
> >> • _previousAttributes: Object
> >> • attributes: Object
> >> • changed: Object
> >> • cid: "c-B020CC239CE646CFB780901EBA53DAB1"
> >> • collection: e
> >> • convert_to_ref: function (){return t.apply(e,arguments)}
> >> • get_obj: function (){return t.apply(e,arguments)}
> >> • id: "72004c73-f799-4315-8ac5-6e3510d5a76a"
> >> • inited: true
> >> • properties: Object
> >> • property_cache: Object
> >> • resolve_ref: function (){return t.apply(e,arguments)}
> >> • rpc: function (){return t.apply(e,arguments)}
> >> • __proto__: s
> >>
> >> TypeError
> >> test.html:5382
> >> Uncaught TypeError: Cannot read property '_listenId' of undefined
> >>
> >>
> >>
> >> Can anyone help me with this?
> >>
> >> best regards,
> >> Mathis
> >>
> >>
> >> --
> >> You received this message because you are subscribed to the Google Groups "Bokeh Discussion - Public" group.
> >> To unsubscribe from this group and stop receiving emails from it, send an email to [email protected].
> >> To post to this group, send email to [email protected].
> >> To view this discussion on the web visit https://groups.google.com/a/continuum.io/d/msgid/bokeh/c6d62b83-44a3-4f82-8671-d45d5314dd48%40continuum.io\.
> >> For more options, visit https://groups.google.com/a/continuum.io/groups/opt_out\.
> >
>
> --
> You received this message because you are subscribed to the Google Groups "Bokeh Discussion - Public" group.
> To unsubscribe from this group and stop receiving emails from it, send an email to [email protected].
> To post to this group, send email to [email protected].
> To view this discussion on the web visit https://groups.google.com/a/continuum.io/d/msgid/bokeh/DD086B78-684E-4C2D-9FA6-1BE4E42F0FA2%40continuum.io\.
> For more options, visit https://groups.google.com/a/continuum.io/groups/opt_out\.
>
>
> --
> You received this message because you are subscribed to the Google Groups "Bokeh Discussion - Public" group.
> To unsubscribe from this group and stop receiving emails from it, send an email to [email protected].
> To post to this group, send email to [email protected].
> To view this discussion on the web visit https://groups.google.com/a/continuum.io/d/msgid/bokeh/CA%2BrVv7kfrkzhVGKzTED4gSnpqOjK1NLyic6JKkt7JXTEV1rMEA%40mail.gmail.com\.
> For more options, visit https://groups.google.com/a/continuum.io/groups/opt_out\.
> <xaxis_limits.png>
--
You received this message because you are subscribed to the Google Groups "Bokeh Discussion - Public" group.
To unsubscribe from this group and stop receiving emails from it, send an email to [email protected].
To post to this group, send email to [email protected].
To view this discussion on the web visit https://groups.google.com/a/continuum.io/d/msgid/bokeh/793D8F79-2E10-4586-92C9-3C6F45FF65A1%40continuum.io\.
For more options, visit https://groups.google.com/a/continuum.io/groups/opt_out\.
--
You received this message because you are subscribed to the Google Groups "Bokeh Discussion - Public" group.
To unsubscribe from this group and stop receiving emails from it, send an email to [email protected].
To post to this group, send email to [email protected].
To view this discussion on the web visit https://groups.google.com/a/continuum.io/d/msgid/bokeh/CA%2BrVv7%3DcHU71jybbJHNHLq8aLEFDYGyfhoKS0Gbi96_3PZPf0A%40mail.gmail.com\.
For more options, visit https://groups.google.com/a/continuum.io/groups/opt_out\.
<xaxis_limits_datetime.png>