RobM
April 9, 2021, 10:58am
1
Hello,
from bokeh.io import output_file, show
from bokeh.plotting import figure
output_file("bars.html")
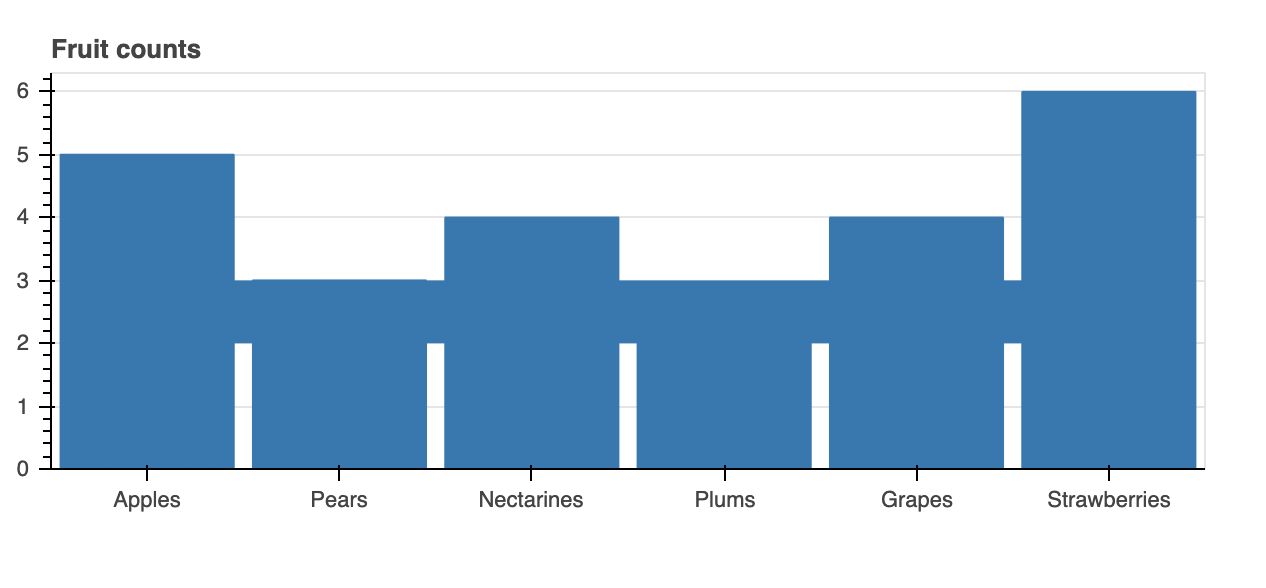
fruits = ['Apples', 'Pears', 'Nectarines', 'Plums', 'Grapes', 'Strawberries']
counts = [5, 3, 4, 2, 4, 6]
p = figure(x_range=fruits, plot_height=250, title="Fruit counts",
toolbar_location=None, tools="")
p.vbar(x=fruits, top=counts, width=0.9)
p.varea(x=fruits, y1=2, y2=3)
p.xgrid.grid_line_color = None
p.y_range.start = 0
show(p)
_jm
April 9, 2021, 11:29am
2
@RobM
Your minimal example works as expected (tested with bokeh 2.2.3 and Chrome 89.0.4389.114).
Here’s the output with the code as provided …
And here’s the output with the p.varea statement commented-out.
RobM
April 9, 2021, 12:30pm
3
Ah, ok thanks for checking. It looks like I’m stuck on verison 1.0.4 which I guess is the problem.
Bryan
April 9, 2021, 3:49pm
4
varea, harea, etc were added in version 1.2 so you would need to update to at least that.
RobM
April 12, 2021, 4:11pm
5
Hi,
rom bokeh.io import output_file, show
from bokeh.plotting import figure
from bokeh.models.tools import HoverTool

output_file("bars.html")

fruits = ['Apples', 'Pears', 'Nectarines', 'Plums', 'Grapes', 'Strawberries']
counts = [5, 3, 4, 2, 4, 6]
tooltips=[('Index', '$index'), ('Count', '@top')]
p = figure(x_range=fruits, plot_height=250, title="Fruit counts", tools=['hover'], tooltips=tooltips)
hover_tool = p.select(type=HoverTool)
hover_tool.names = ["bar"]
p.vbar(x=fruits, top=counts, width=0.9, name='bar')
p.varea(x=[0, len(fruits)], y1=2, y2=3, color='red', alpha=0.4, name='area')
p.xgrid.grid_line_color = None
p.y_range.start = 0

show(p)
Bryan
April 12, 2021, 4:28pm
6
@RobM You need to describe what you want to accomplish in more detail, I don’t understand your question.
RobM
April 12, 2021, 4:49pm
7
Sorry, perhaps it isn’t possible with varea but I have an example sort of working with patches. What I would like to know is can I specify separate tooltips for the different glyphs? I’d like to avoid the green patch hover tool box showing “Count:???”.
from bokeh.io import output_file, show
from bokeh.plotting import figure
from bokeh.models.tools import HoverTool

output_file("bars.html")

fruits = ['Apples', 'Pears', 'Nectarines', 'Plums', 'Grapes', 'Strawberries']
counts = [5, 3, 4, 2, 4, 6]
tooltips=[('Index', '$index'), ('Count', '@top')]

p = figure(x_range=fruits, plot_height=250, title="Fruit counts", tools=['hover'], tooltips=tooltips)
hover_tool = p.select(type=HoverTool)
hover_tool.names = ["bar", "patch"]

p.vbar(x=fruits, top=counts, width=0.9, name='bar')
p.varea(x=[0, len(fruits)], y1=2, y2=3, color='red', alpha=0.4, name='area')
p.patches([[0,0,len(fruits),len(fruits)]],[[3,4,4,3]], color='green', alpha=0.4, name='patch')
p.xgrid.grid_line_color = None
p.y_range.start = 0

show(p)
Bryan
April 12, 2021, 5:05pm
8
By default, hover tools operate on all available renderers. But you can add multiple different hover tools, and restrict each to only a specific glyph (or glyphs) by configring their renderers
RobM
April 12, 2021, 5:09pm
9
thanks that was what I was hoping, but I haven’t worked out how to do it yet. Tools and tooltips are added when setting up the figure, how do I go about adding a second hover tool?
_jm
April 12, 2021, 5:41pm
10
@RobM
That’s certainly a common way to include a hover tool but not the only way.
You can create a hover tool and specify its properties including the renderers property as a list that you want to operate on / restrict focus to.
So something like the following where r0 and r1 are two renderers previously created each assigned to its own HoverTool h0 and h1, respectively.
The last line in this sketch/outline assigns both tools to a figure p.
from bokeh.models import HoverTool
...
h0 = HoverTool(renderers=[r0], ...)
h1 = HoverTool(renderers=[r1], ...)
_ = [p.add_tools(tool) for tool in (h0, h1)]
RobM
April 12, 2021, 5:43pm
11
Thanks, I’ll give that a go. I had been trying things like this
p = figure(x_range=fruits, plot_height=250, title="Fruit counts", tools=['hover, hover'])

hover0 = p.select(type=HoverTool)
hover0.names = ["bar"]
hover0.tooltips = [('Index', '$index'), ('Count', '@top')]

hover1 = p.select(type=HoverTool)
hover1.names = ["patch"]
hover1.tooltips = [('Index', '$index'), ('Y2', '6')]
Bryan
April 12, 2021, 5:49pm
12
The tools (or hover) args to figure are conveniences for the common case. They only add a single HoverTool to the plot, so then p.select(type=HoverTool) will return the same hover tool instance every time you call it. If you need multiple hover tools then they have to be added manually / individually as @_jm demonstrated. More documentation is here
Configuring plot tools — Bokeh 2.4.2 Documentation
RobM
April 12, 2021, 6:32pm
13
Thanks all, I have a working example now that I think I can work from.
from bokeh.io import output_file, show
from bokeh.plotting import figure
from bokeh.models.tools import HoverTool

output_file("bars.html")

fruits = ['Apples', 'Pears', 'Nectarines', 'Plums', 'Grapes', 'Strawberries']
counts = [5, 3, 4, 2, 4, 6]

p = figure(x_range=fruits, plot_height=250, title="Fruit counts", tools="")

bar = p.vbar(x=fruits, top=counts, width=0.9)
patch = p.patches([[0,0,len(fruits),len(fruits)]],[[3,4,4,3]], color='green', alpha=0.4)

p.xgrid.grid_line_color = None
p.y_range.start = 0

h0 = HoverTool(renderers=[bar])
h0.tooltips = [('Index', '$index'), ('Count', '@top')]
p.add_tools(h0)

h1 = HoverTool(renderers=[patch])
h1.tooltips = [('Count', '3 to 4')]
p.add_tools(h1)

show(p)
1 Like
RobM
April 12, 2021, 8:03pm
14
although I’m finding patches a lot tricker to use than varea with a columnDataSource