Plot showing the issue is [here](https://rawgit.com/jcrist/0e3ae830bfff4fd0cb6b/…raw/0b141c560f78b93a5ab31b445a0cf0645c130508/hover_overlap.html)
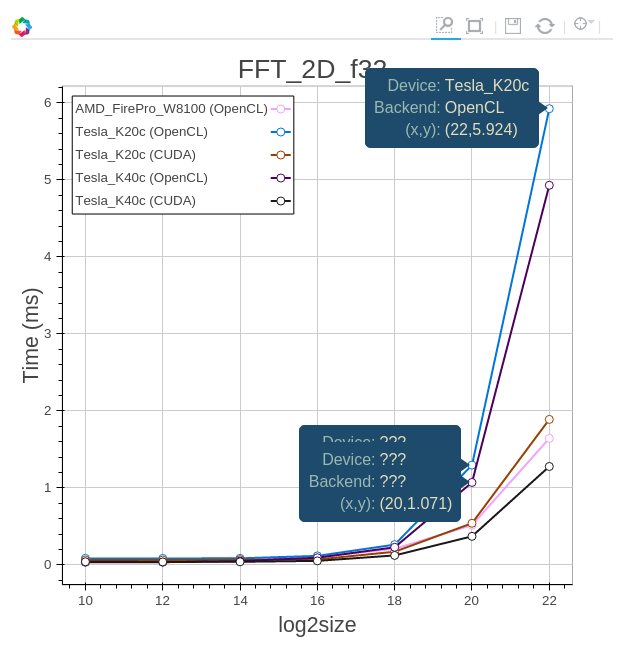
If you hover over the plot, sometimes multiple tooltips will show up, for lines that aren't being currently hovered over.
This is on bokeh 0.10, shows up for bokeh 0.9 as well. Came up when working on profiling for dask, which is where this data came from. Code to create that plot:
``` python
import bokeh.plotting as bp
from bokeh.models import HoverTool
bp.output_file('test.html')
data = [[0, 0, 0, 0, 0, 0, 0, 0, 0, 0, 1, 1, 1, 1, 1, 1, 1, 1, 1, 1, 1, 1, 1, 1, 1, 1, 1, 1, 1, 1, 0, 0],
[0, 0, 0, 0, 0, 0, 0, 0, 0, 0, 0, 0, 0, 0, 0, 1, 2, 3, 4, 4, 4, 4, 4, 5, 6, 7, 8, 8, 8, 9, 10, 0],
[1, 2, 3, 4, 5, 6, 7, 8, 9, 10, 10, 9, 8, 7, 6, 6, 6, 6, 6, 5, 4, 3, 2, 2, 2, 2, 2, 1, 0, 0, 0, 0],
[0, 0, 0, 0, 0, 0, 0, 0, 0, 0, 0, 1, 2, 3, 4, 3, 2, 1, 0, 1, 2, 3, 4, 3, 2, 1, 0, 1, 2, 1, 0, 0]]
time = [0.2505, 0.2510, 0.2511, 0.2581, 0.4891, 0.4936, 0.4945, 0.5020, 0.6182,
0.6226, 1.5743, 1.6170, 1.6289, 1.6450, 1.6503, 1.6758, 1.6760, 1.6915,
1.7010, 1.7172, 1.7319, 1.7481, 1.7671, 1.7855, 1.7983, 1.8124, 1.8308,
1.8368, 1.8527, 1.8636, 1.8727, 1.8728]
labels = ['qr(vstack(tuple([getitem(...), getitem(...), getitem(...), ...])))',
'many([_], [getitem(_, *)])',
'qr(_apply_random(*, *, *, *, *))',
'dot(getitem(_, *), getitem(getitem(...), *))']
colors = ['red', 'blue', 'green', 'purple']
p = bp.figure(x_range=[0, max(time)], plot_width=800, plot_height=300,
tools="hover,save,reset,resize,xwheel_zoom,xpan")
for y, label, color in zip(data, labels, colors):
source = bp.ColumnDataSource({'x': time, 'y': y, 'label': [label]*len(time)})
p.line('x', 'y', line_color=color, line_width=3, source=source)
hover = p.select(HoverTool)
hover.tooltips = """
<div>
<span style="font-size: 14px; font-weight: bold;">Task:</span>
<span style="font-size: 10px; font-family: Monaco, monospace;">@label</span>
</div>
"""
bp.show(p)
```