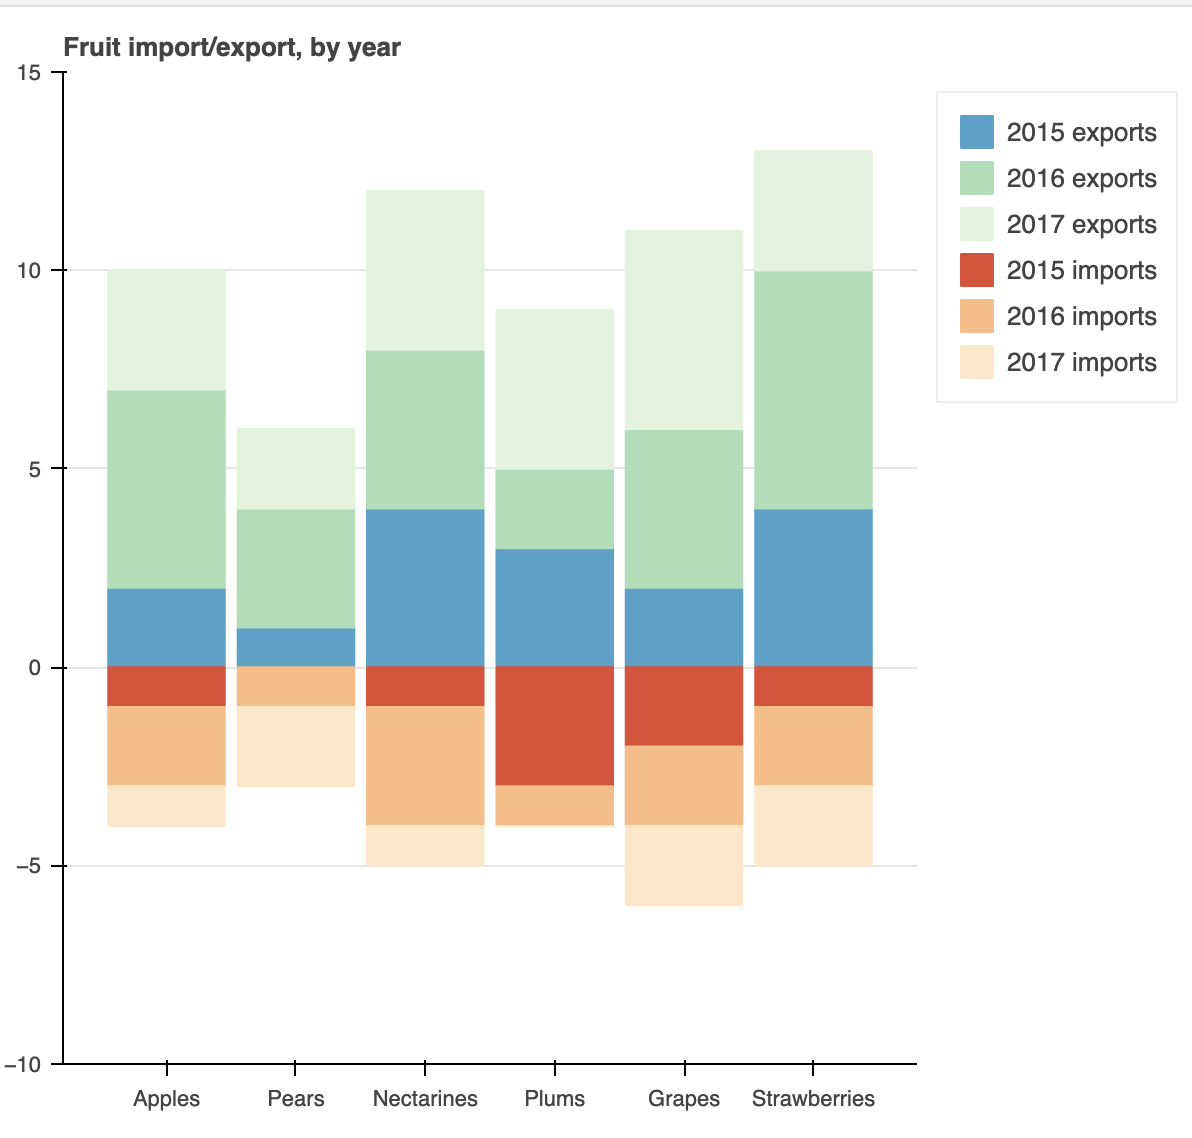
I want to swap the axes, use the x_axes to show the fruits name and y_axes show the values, how to do that?
from bokeh.models import ColumnDataSource
from bokeh.palettes import GnBu3, OrRd3
from bokeh.plotting import figure, show
fruits = ['Apples', 'Pears', 'Nectarines', 'Plums', 'Grapes', 'Strawberries']
years = ["2015", "2016", "2017"]
exports = {'fruits' : fruits,
'2015' : [2, 1, 4, 3, 2, 4],
'2016' : [5, 3, 4, 2, 4, 6],
'2017' : [3, 2, 4, 4, 5, 3]}
imports = {'fruits' : fruits,
'2015' : [-1, 0, -1, -3, -2, -1],
'2016' : [-2, -1, -3, -1, -2, -2],
'2017' : [-1, -2, -1, 0, -2, -2]}
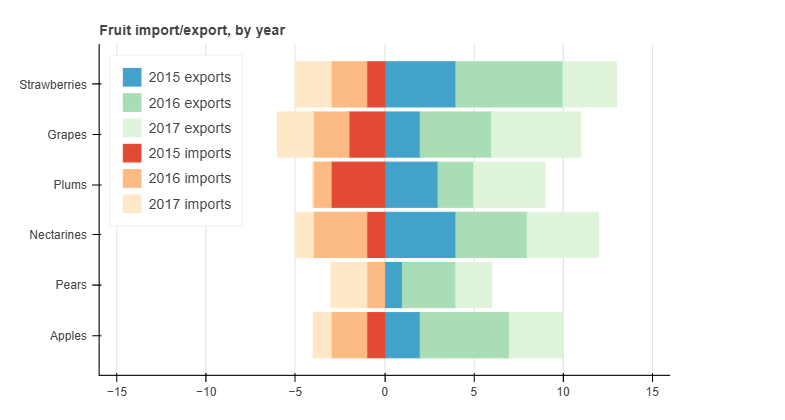
p = figure(y_range=fruits, height=350, x_range=(-16, 16), title="Fruit import/export, by year",
toolbar_location=None)
p.hbar_stack(years, y='fruits', height=0.9, color=GnBu3, source=ColumnDataSource(exports),
legend_label=[f"{year} exports" for year in years])
p.hbar_stack(years, y='fruits', height=0.9, color=OrRd3, source=ColumnDataSource(imports),
legend_label=[f"{year} imports" for year in years])
p.y_range.range_padding = 0.1
p.ygrid.grid_line_color = None
p.legend.location = "top_left"
p.axis.minor_tick_line_color = None
p.outline_line_color = None
show(p)