How to trigger Hover(and tooltips) in multiple figures simultaneously?

What are you trying to do?

I have multiple figures (each with some lines), sharing x-axis but not the y-axis. When my cursor hover on one figure, it will tell me the values(x & y-axis values). But Others have no tooltips. I want all figures show tooltips simultaneously when cursor hover any figure.

What have you tried that did NOT work as expected? If you have also posted this question elsewhere (e.g. StackOverflow), please include a link to that post.

I have searched internet, got almost no result. Can the Crosshair tool trigger hover points? - #2 by Bryan

import numpy as np

import bokeh
from bokeh.plotting import figure, show, output_notebook
from bokeh.models import Slider, HoverTool, CustomJS, ColumnDataSource
from bokeh.layouts import column
from bokeh.models import CustomJS, CrosshairTool


from bokeh.layouts import layout
output_notebook()

N = 100
x = np.arange(N) + np.random.random(size=N)
y = np.arange(N) * 0.5 + np.random.random(size=N)

source = ColumnDataSource(dict(x=x, y=y))


TOOLS="hover,crosshair,pan,wheel_zoom,zoom_in,zoom_out,box_zoom,undo,redo,reset,tap,save,box_select,poly_select,lasso_select,"

p = figure(tools=TOOLS, height=300, width=300)
l1_rnder = p.line(x='x', y='y', source=source)


p2 = figure(tools=TOOLS, height=300, width=300)
l2_rnder = p2.line(x='x', y='y', source=source)

p.add_tools(bokeh.models.HoverTool(show_arrow=True, 
                                     line_policy='next', 
                                     mode='vline',
                                     renderers=[l1_rnder],
                                     tooltips=[('X', '$x'),('Y', '$y')]))

p2.add_tools(bokeh.models.HoverTool(show_arrow=True, 
                                     line_policy='next', 
                                     mode='vline',
                                     renderers=[l2_rnder],
                                     tooltips=[('X', '$x'),('Y', '$y')]))


def addLinkedCrosshairs(plots):
    crosshair = CrosshairTool(dimensions="height")
    for p in plots:
        p.add_tools(crosshair)
addLinkedCrosshairs([p, p2])

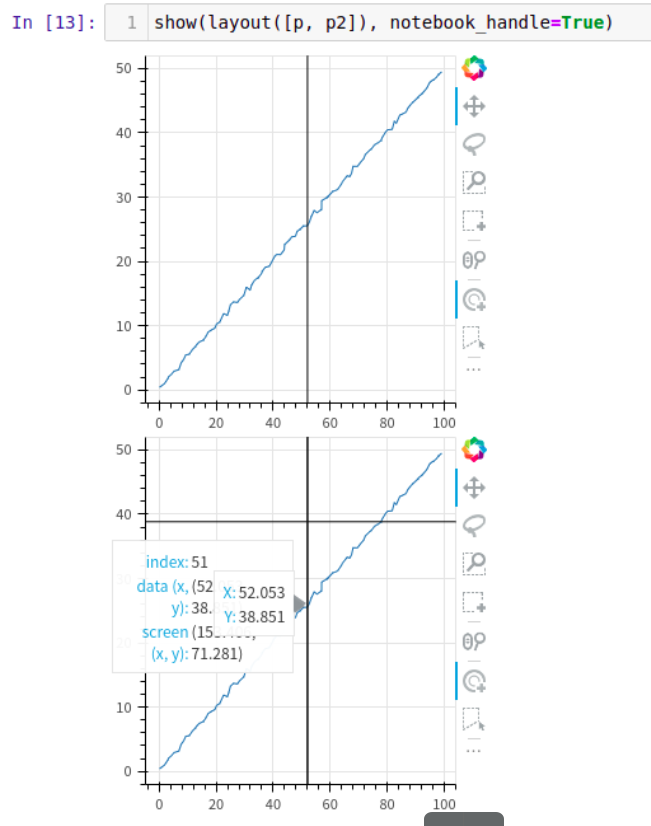
show(layout([p, p2]), notebook_handle=True)

Present outlook is as follows. Only one figure gives tooltips.

1 Like

I am afraid there is not currently any ability to link hover tools across plots, nor is there currently any way to programmatically raise tooltips manually. Your best best for now would be a hover callback that populates an off-plot Div and/or manually highlights the other plot with a glyph in some way.

3 Likes

Thanks, this is good info.

One think I’ll add/share what I’ve discovered, which is kinda related to this, is that you can at least trigger hover glyphs across multiple plots, at least on the scatter glyph, through CustomJS, the CDS.inspected.indices property, and assigning that CustomJS to the hovertool. This is helping me build linked plots that have a “many to one” relationship.

Here’s an example of this:

from bokeh.models import ColumnDataSource, Scatter, CustomJS,HoverTool
from bokeh.plotting import figure, show
from bokeh.layouts import layout

#two sources, but they are related through loc_id field
pv_src = ColumnDataSource(data={'loc_id':['A','B','C'],'x':[1,2,3],'y':[1,3,2]})
xs_src = ColumnDataSource(data={'loc_id':['A','A','A','B','B','B','B','C','C'],'xxs':[1,1,1,2,2,2,2,3,3],'z':[10,8,4,9,6,3,2,9,4]})

pv = figure()
xs = figure()

pvg = Scatter(x='x',y='y',size=10)
pvhg = Scatter(x='x',y='y',fill_color='purple',size=10)
pvr = pv.add_glyph(pv_src,pvg,hover_glyph=pvhg)

xsg = Scatter(x='xxs',y='z',size=10)
xshg = Scatter(x='xxs',y='z',fill_color='purple',size=10)
xsr = xs.add_glyph(xs_src,xsg,hover_glyph=xshg)

#CustomJS --> essentially sql left join
#may need optimization/legit sql-like joining algo here as it gets laggy on large datasets.
pv_custom = CustomJS(args=dict(pv_src=pv_src,xs_src=xs_src)
                         ,code="""
                         //get first inspected indices                         
                         if (pv_src.inspected.indices.length>0){
                                 var pv_inds = pv_src.inspected.indices
                                 //get loc_ids
                                 var loc_ids = []
                                 for (var i=0; i<pv_inds.length;i++){
                                         loc_ids.push(pv_src.data['loc_id'][pv_inds[i]])}
                                 //get inds for those loc_ids on xs
                                 var xs_inds = []
                                 for (var i=0;i<xs_src.data['loc_id'].length;i++){
                                         if (loc_ids.includes(xs_src.data['loc_id'][i])){
                                                 xs_inds.push(i)}
                                         }
                                 xs_src.inspected.indices = xs_inds
                                 xs_src.change.emit()
                                 }
                         else {xs_src.inspected.indices=[]
                               xs_src.change.emit()}                             
                        """)
                        
xs_custom = CustomJS(args=dict(pv_src=pv_src,xs_src=xs_src)
                         ,code="""
                         //get first inspected indices                         
                         if (xs_src.inspected.indices.length>0){
                                 var xs_inds = xs_src.inspected.indices
                                 //get loc_ids
                                 var loc_ids = []
                                 for (var i=0; i<xs_inds.length;i++){
                                         loc_ids.push(xs_src.data['loc_id'][xs_inds[i]])}
                                 //get inds for those loc_ids on pv
                                 var pv_inds = []
                                 for (var i=0;i<pv_src.data['loc_id'].length;i++){
                                         if (loc_ids.includes(pv_src.data['loc_id'][i])){
                                                 pv_inds.push(i)}
                                         }
                                 pv_src.inspected.indices = pv_inds
                                 pv_src.change.emit()
                                 }
                         else {pv_src.inspected.indices=[]
                               pv_src.change.emit()}                             
                        """)

pv_hvr = HoverTool(renderers=[pvr],tooltips=[('','@loc_id')],callback=pv_custom)
pv.add_tools(pv_hvr)

xs_hvr = HoverTool(renderers=[xsr],tooltips=[('','@loc_id')],callback=xs_custom)
xs.add_tools(xs_hvr)
lo = layout([pv,xs])
show(lo)

many

2 Likes

This topic was automatically closed 90 days after the last reply. New replies are no longer allowed.