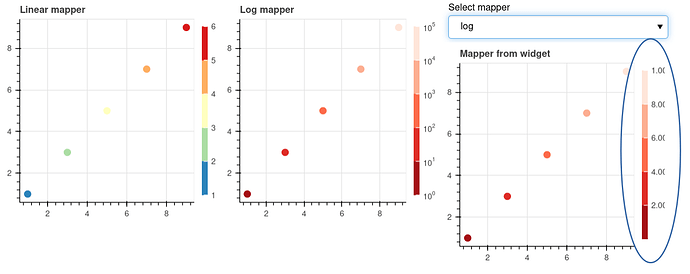
I am trying to update a ColorBar based on a selector so that either the color mapping is LinearColorMapper or LogColorMapper. I am able to update the color mapping it-self, but
- Format of the tick numbers is wrong/does not gets updated on the ColorBar when
LogColorMapperis chosen - Width of plot does not seem to adjust to width
ColorBarwhen switching (tick labels gets cut-off to the left)
One observation: the ColorBar is only updated in-sync as long as the ColorBar color_mapper is updated before updating the glyph color mapping (using a dict).
Anything I need to change in the update function in order to have the ColorBar update correctly? Using the bokeh serve functionality.
I’m using Bokeh version 2.3.1, FireFox, RedHat 7.0
from bokeh.models import ColorBar, ColumnDataSource
from bokeh.transform import linear_cmap, log_cmap
from bokeh.io import curdoc
from bokeh.plotting import figure
from bokeh.layouts import row, column
from bokeh.models.widgets import Select
from bokeh.palettes import Spectral5, Reds5


x = [1,3,5,7,9]
y = [1,3,5,7,9]
p1 = [1,2,3,4,5]
p2 = [1,10,100,1000,10000]
src = ColumnDataSource(data = {'x': x, 'y': y, 'p1': p1, 'p2': p2})

MAPPER = {
    'linear': linear_cmap(field_name = 'p1', palette = Spectral5, low = 1, high = 6),
    'log': log_cmap(field_name = 'p2', palette = Reds5, low = 1, high = 100000),
}

def create_fig(mapper, title):
    p = figure(plot_width = 300, plot_height = 300, title = title, toolbar_location = None)
    p.circle(x='x', y='y', line_color=None, color=mapper, size=10, source=src, name = 'glyph')

    color_bar = ColorBar(color_mapper=mapper['transform'], width=8, name = 'color_bar')
    p.add_layout(color_bar, 'right')

    return p


map_select = Select(
    title = 'Select mapper',
    options = list(MAPPER.keys()),
    value = list(MAPPER.keys())[0]
)

p1 = create_fig(MAPPER['linear'], 'Linear mapper')
p2 = create_fig(MAPPER['log'], 'Log mapper')
p3 = create_fig(MAPPER[map_select.value], 'Mapper from widget')

def update_mapper(attr, old, new):
    new_map = MAPPER[new]

    # important to update colorbar BEFORE glyph otherwise update not triggered
    # however ticker/formatter does not seem to update correctly with LogColorMapper
    # for the ColorBar
    cbar = p3.select(name = 'color_bar')
    cbar.color_mapper = new_map['transform']

    # important to update with dictionary otherwise update not triggered
    r = p3.select(name = 'glyph')
    r.glyph.fill_color = dict(field = new_map['field'], transform = new_map['transform'])


map_select.on_change('value', update_mapper)

layout = row(p1,p2,column(map_select, p3))

curdoc().add_root(layout)
