I don’t see a simple way to indicate to Line that you want to use the index values of the dataframe as the x values. There may be a design decision not to automatically use the index of the dataframe.
One way to work around this is to add the index as a column and tell Line to use that.
p = Line(data=df.assign(x=df.index), x=‘x’, y=‘a’, title=“Test”, plot_width=500, plot_height=300)
``
Hope this helps.
Dennis
···
On Sunday, April 17, 2016 at 9:00:27 AM UTC-7, Daniel Krause wrote:
I use DataFrames with custom index values, e.g.:
a
10 0
20 1
30 2
40 3
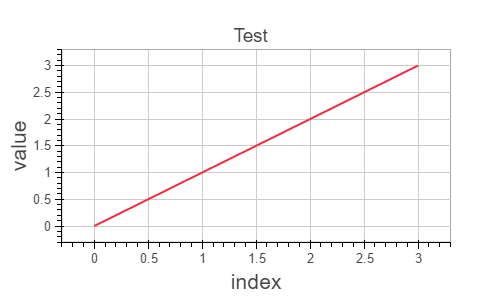
When I use bokeh.charts I get:
The index is labeled from 0 to 3 instead from 10 to 40.
If there's not currently a way to use the index, it might be worth opening an issue to discuss adding that capability.
Bryan
···
On Apr 18, 2016, at 12:27 AM, Dennis O'Brien <[email protected]> wrote:
Hi Daniel,
I don't see a simple way to indicate to Line that you want to use the index values of the dataframe as the x values. There may be a design decision not to automatically use the index of the dataframe.
One way to work around this is to add the index as a column and tell Line to use that.
p = Line(data=df.assign(x=df.index), x='x', y='a', title="Test", plot_width=500, plot_height=300)
Hope this helps.
Dennis
On Sunday, April 17, 2016 at 9:00:27 AM UTC-7, Daniel Krause wrote:
I use DataFrames with custom index values, e.g.:
a
10 0
20 1
30 2
40 3
When I use bokeh.charts I get:
The index is labeled from 0 to 3 instead from 10 to 40.
Is there any way to use the index values?
My test code:
if __name__ == '__main__':
from bokeh.io import show, output_file
from bokeh.charts import Line
import pandas
import subprocess
import time
# a test DataFrame
d = {'a': [0,1,2,3]}
index = [10,20,30,40]
df = pandas.DataFrame(data=d, index=index)
print(df)
# starting the bokeh server
args = ['python', '-m', 'bokeh', 'serve']
p = subprocess.Popen(args)
time.sleep(1) #waiting for the bokeh server to initialize
On Sun, Apr 17, 2016 at 10:35 PM Bryan Van de Ven [email protected] wrote:
If there’s not currently a way to use the index, it might be worth opening an issue to discuss adding that capability.
Bryan
On Apr 18, 2016, at 12:27 AM, Dennis O’Brien [email protected] wrote:
Hi Daniel,
I don’t see a simple way to indicate to Line that you want to use the index values of the dataframe as the x values. There may be a design decision not to automatically use the index of the dataframe.
One way to work around this is to add the index as a column and tell Line to use that.
p = Line(data=df.assign(x=df.index), x=‘x’, y=‘a’, title=“Test”, plot_width=500, plot_height=300)
Hope this helps.
Dennis
On Sunday, April 17, 2016 at 9:00:27 AM UTC-7, Daniel Krause wrote:
I use DataFrames with custom index values, e.g.:
a
10 0
20 1
30 2
40 3
When I use bokeh.charts I get:
The index is labeled from 0 to 3 instead from 10 to 40.
Is there any way to use the index values?
My test code:
if name == ‘main’:
from [bokeh.io](http://bokeh.io) import show, output_file
from bokeh.charts import Line
import pandas
import subprocess
import time
# a test DataFrame
d = {'a': [0,1,2,3]}
index = [10,20,30,40]
df = pandas.DataFrame(data=d, index=index)
print(df)
# starting the bokeh server
args = ['python', '-m', 'bokeh', 'serve']
p = subprocess.Popen(args)
time.sleep(1) #waiting for the bokeh server to initialize
output_file('test.html')
plot_w = 500
plot_h = 300
p = Line(df,
title="Test",
plot_width = plot_w,
plot_height = plot_h,
)
show(p)
–
You received this message because you are subscribed to the Google Groups “Bokeh Discussion - Public” group.
To unsubscribe from this group and stop receiving emails from it, send an email to [email protected].