Hi all, Thanks for Bokeh! I have been able to create some pretty cool visualizations just after a couple of days of learning. Now I figure it would be fun to learn Jupyter notebook (which I really know nothing about).
Going from your docs where it says:
To display Bokeh plots inline in an Jupyter notebook, use the output_notebook() function from bokeh.io instead of (or in addition to) the output_file() function we have seen previously. No other modifications are required. You can see an example below:
I modified one of the example scripts accordingly:
from bokeh.charts import BoxPlot, output_notebook, show
from bokeh.sampledata.autompg import autompg as df
from bokeh.resources import INLINE
output_notebook(resources=INLINE)
p = BoxPlot(df, values=‘mpg’, label=‘cyl’, color=‘cyl’,
title=“MPG Summary (grouped and shaded by CYL)”)
show(p)
Now how do I load that into my notebook? I have installed jupyer and I see:
The Jupyter Notebook is running at: http://localhost:8888/
When I run the python script, I just see this warning and nothing displays.
BokehJS does not appear to have successfully loaded. If loading BokehJS from CDN, this
may be due to a slow or bad network connection. Possible fixes:
- ALWAYS run
output_notebook() in a cell BY ITSELF, AT THE TOP, with no other code
- re-rerun
output_notebook() to attempt to load from CDN again, or
- use INLINE resources instead, as so:
from bokeh.resources import INLINE
output_notebook(resources=INLINE)
warnings.warn(_NB_LOAD_WARNING)
Thanks in advance
Hi Alex,
Works for me.
I am on
Python 3.5.2 |Anaconda 4.1.1 (32-bit)| (default, Jul 5 2016, 11:45:57) [MSC v.1900 32 bit (Intel)]
Type “copyright”, “credits” or “license” for more information.
IPython 4.2.0 – An enhanced Interactive Python.
Bokeh 0.12.1.
Greetings,
Rakesh
···
On Wed, Aug 24, 2016 at 2:33 PM, Alex Rice [email protected] wrote:
Hi all, Thanks for Bokeh! I have been able to create some pretty cool visualizations just after a couple of days of learning. Now I figure it would be fun to learn Jupyter notebook (which I really know nothing about).
Going from your docs where it says:
To display Bokeh plots inline in an Jupyter notebook, use the output_notebook() function from bokeh.io instead of (or in addition to) the output_file() function we have seen previously. No other modifications are required. You can see an example below:
I modified one of the example scripts accordingly:
from bokeh.charts import BoxPlot, output_notebook, show
from bokeh.sampledata.autompg import autompg as df
from bokeh.resources import INLINE
output_notebook(resources=INLINE)
p = BoxPlot(df, values=‘mpg’, label=‘cyl’, color=‘cyl’,
title=“MPG Summary (grouped and shaded by CYL)”)
show(p)
Now how do I load that into my notebook? I have installed jupyer and I see:
The Jupyter Notebook is running at: http://localhost:8888/
When I run the python script, I just see this warning and nothing displays.
BokehJS does not appear to have successfully loaded. If loading BokehJS from CDN, this
may be due to a slow or bad network connection. Possible fixes:
- ALWAYS run
output_notebook() in a cell BY ITSELF, AT THE TOP, with no other code
- re-rerun
output_notebook() to attempt to load from CDN again, or
- use INLINE resources instead, as so:
from bokeh.resources import INLINE
output_notebook(resources=INLINE)
warnings.warn(_NB_LOAD_WARNING)
Thanks in advance
–
You received this message because you are subscribed to the Google Groups “Bokeh Discussion - Public” group.
To unsubscribe from this group and stop receiving emails from it, send an email to [email protected].
To post to this group, send email to [email protected].
To view this discussion on the web visit https://groups.google.com/a/continuum.io/d/msgid/bokeh/CACmK6Bv%3Dq04xXvMM-VA_mNQFOTHh%2BAt4G34B%3DK4wZUay6ewmOg%40mail.gmail.com.
For more options, visit https://groups.google.com/a/continuum.io/d/optout.
Hi Rakesh, OK great- so how do you start it? How do you launch the script and get it to appear in your notebook?
···
On Wed, Aug 24, 2016 at 3:59 PM, Rakesh Partapsing [email protected] wrote:
Hi Alex,
Works for me.
I am on
Python 3.5.2 |Anaconda 4.1.1 (32-bit)| (default, Jul 5 2016, 11:45:57) [MSC v.1900 32 bit (Intel)]
Type “copyright”, “credits” or “license” for more information.
IPython 4.2.0 – An enhanced Interactive Python.
Bokeh 0.12.1.
Greetings,
Rakesh
–
You received this message because you are subscribed to the Google Groups “Bokeh Discussion - Public” group.
To unsubscribe from this group and stop receiving emails from it, send an email to [email protected].
To post to this group, send email to [email protected].
To view this discussion on the web visit https://groups.google.com/a/continuum.io/d/msgid/bokeh/CAKGpf618Uhnpt%2Bb5Qsd58%3DtfqSnhqvMpy5wCROTsbw4F%2BzauxA%40mail.gmail.com.
For more options, visit https://groups.google.com/a/continuum.io/d/optout.
On Wed, Aug 24, 2016 at 2:33 PM, Alex Rice [email protected] wrote:
Hi all, Thanks for Bokeh! I have been able to create some pretty cool visualizations just after a couple of days of learning. Now I figure it would be fun to learn Jupyter notebook (which I really know nothing about).
Going from your docs where it says:
To display Bokeh plots inline in an Jupyter notebook, use the output_notebook() function from bokeh.io instead of (or in addition to) the output_file() function we have seen previously. No other modifications are required. You can see an example below:
I modified one of the example scripts accordingly:
from bokeh.charts import BoxPlot, output_notebook, show
from bokeh.sampledata.autompg import autompg as df
from bokeh.resources import INLINE
output_notebook(resources=INLINE)
p = BoxPlot(df, values=‘mpg’, label=‘cyl’, color=‘cyl’,
title=“MPG Summary (grouped and shaded by CYL)”)
show(p)
Now how do I load that into my notebook? I have installed jupyer and I see:
The Jupyter Notebook is running at: http://localhost:8888/
When I run the python script, I just see this warning and nothing displays.
BokehJS does not appear to have successfully loaded. If loading BokehJS from CDN, this
may be due to a slow or bad network connection. Possible fixes:
- ALWAYS run
output_notebook() in a cell BY ITSELF, AT THE TOP, with no other code
- re-rerun
output_notebook() to attempt to load from CDN again, or
- use INLINE resources instead, as so:
from bokeh.resources import INLINE
output_notebook(resources=INLINE)
warnings.warn(_NB_LOAD_WARNING)
Thanks in advance
–
You received this message because you are subscribed to the Google Groups “Bokeh Discussion - Public” group.
To unsubscribe from this group and stop receiving emails from it, send an email to [email protected].
To post to this group, send email to [email protected].
To view this discussion on the web visit https://groups.google.com/a/continuum.io/d/msgid/bokeh/CACmK6Bv%3Dq04xXvMM-VA_mNQFOTHh%2BAt4G34B%3DK4wZUay6ewmOg%40mail.gmail.com.
For more options, visit https://groups.google.com/a/continuum.io/d/optout.
Just executed it. See screenshot.
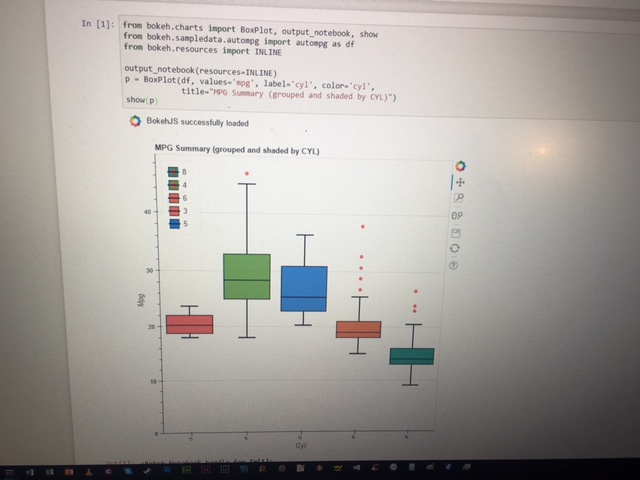
I would suggest updating all required libs to the latest version.
···
Met vriendelijke groet,
Best wishes,
Rakesh
On 25 aug. 2016, at 00:02, Alex Rice [email protected] wrote:
Hi Rakesh, OK great- so how do you start it? How do you launch the script and get it to appear in your notebook?
On Wed, Aug 24, 2016 at 3:59 PM, Rakesh Partapsing [email protected] wrote:
Hi Alex,
Works for me.
I am on
Python 3.5.2 |Anaconda 4.1.1 (32-bit)| (default, Jul 5 2016, 11:45:57) [MSC v.1900 32 bit (Intel)]
Type “copyright”, “credits” or “license” for more information.
IPython 4.2.0 – An enhanced Interactive Python.
Bokeh 0.12.1.
Greetings,
Rakesh
On Wed, Aug 24, 2016 at 2:33 PM, Alex Rice [email protected] wrote:
Hi all, Thanks for Bokeh! I have been able to create some pretty cool visualizations just after a couple of days of learning. Now I figure it would be fun to learn Jupyter notebook (which I really know nothing about).
Going from your docs where it says:
To display Bokeh plots inline in an Jupyter notebook, use the output_notebook() function from bokeh.io instead of (or in addition to) the output_file() function we have seen previously. No other modifications are required. You can see an example below:
I modified one of the example scripts accordingly:
from bokeh.charts import BoxPlot, output_notebook, show
from bokeh.sampledata.autompg import autompg as df
from bokeh.resources import INLINE
output_notebook(resources=INLINE)
p = BoxPlot(df, values=‘mpg’, label=‘cyl’, color=‘cyl’,
title=“MPG Summary (grouped and shaded by CYL)”)
show(p)
Now how do I load that into my notebook? I have installed jupyer and I see:
The Jupyter Notebook is running at: http://localhost:8888/
When I run the python script, I just see this warning and nothing displays.
BokehJS does not appear to have successfully loaded. If loading BokehJS from CDN, this
may be due to a slow or bad network connection. Possible fixes:
- ALWAYS run
output_notebook() in a cell BY ITSELF, AT THE TOP, with no other code
- re-rerun
output_notebook() to attempt to load from CDN again, or
- use INLINE resources instead, as so:
from bokeh.resources import INLINE
output_notebook(resources=INLINE)
warnings.warn(_NB_LOAD_WARNING)
Thanks in advance
–
You received this message because you are subscribed to the Google Groups “Bokeh Discussion - Public” group.
To unsubscribe from this group and stop receiving emails from it, send an email to [email protected].
To post to this group, send email to [email protected].
To view this discussion on the web visit https://groups.google.com/a/continuum.io/d/msgid/bokeh/CACmK6Bv%3Dq04xXvMM-VA_mNQFOTHh%2BAt4G34B%3DK4wZUay6ewmOg%40mail.gmail.com.
For more options, visit https://groups.google.com/a/continuum.io/d/optout.
–
You received this message because you are subscribed to the Google Groups “Bokeh Discussion - Public” group.
To unsubscribe from this group and stop receiving emails from it, send an email to [email protected].
To post to this group, send email to [email protected].
To view this discussion on the web visit https://groups.google.com/a/continuum.io/d/msgid/bokeh/CAKGpf618Uhnpt%2Bb5Qsd58%3DtfqSnhqvMpy5wCROTsbw4F%2BzauxA%40mail.gmail.com.
For more options, visit https://groups.google.com/a/continuum.io/d/optout.
–
You received this message because you are subscribed to the Google Groups “Bokeh Discussion - Public” group.
To unsubscribe from this group and stop receiving emails from it, send an email to [email protected].
To post to this group, send email to [email protected].
To view this discussion on the web visit https://groups.google.com/a/continuum.io/d/msgid/bokeh/CACmK6Bs3YaUMCJtFQ97QSZO2%3DCwfb4YPVcjF5Abbit%2BJmXPpKA%40mail.gmail.com.
For more options, visit https://groups.google.com/a/continuum.io/d/optout.
Thanks Rakesh, I was able to get it working. I did a conda update
--all, but that didn't fix it. Then I fiddled around with the
notebook, and if I press interrupt kernel button, then run cell again,
then the bokeh graph displays. Not sure why it has problems at start.
Anyways, cheers
···
On Wed, Aug 24, 2016 at 4:08 PM, Rakesh Partapsing <[email protected]> wrote:
Just executed it. See screenshot.
I would suggest updating all required libs to the latest version.
Met vriendelijke groet,
Best wishes,
Rakesh