I would like to create a 2-column grid where one of the two columns is a fixed width (actually based on widest content) and the other column stretches to fill the remainder of the available space (think “stretch_width”).
It felt like GridBox could do it, but I haven’t been able to figure out how to invoke it.
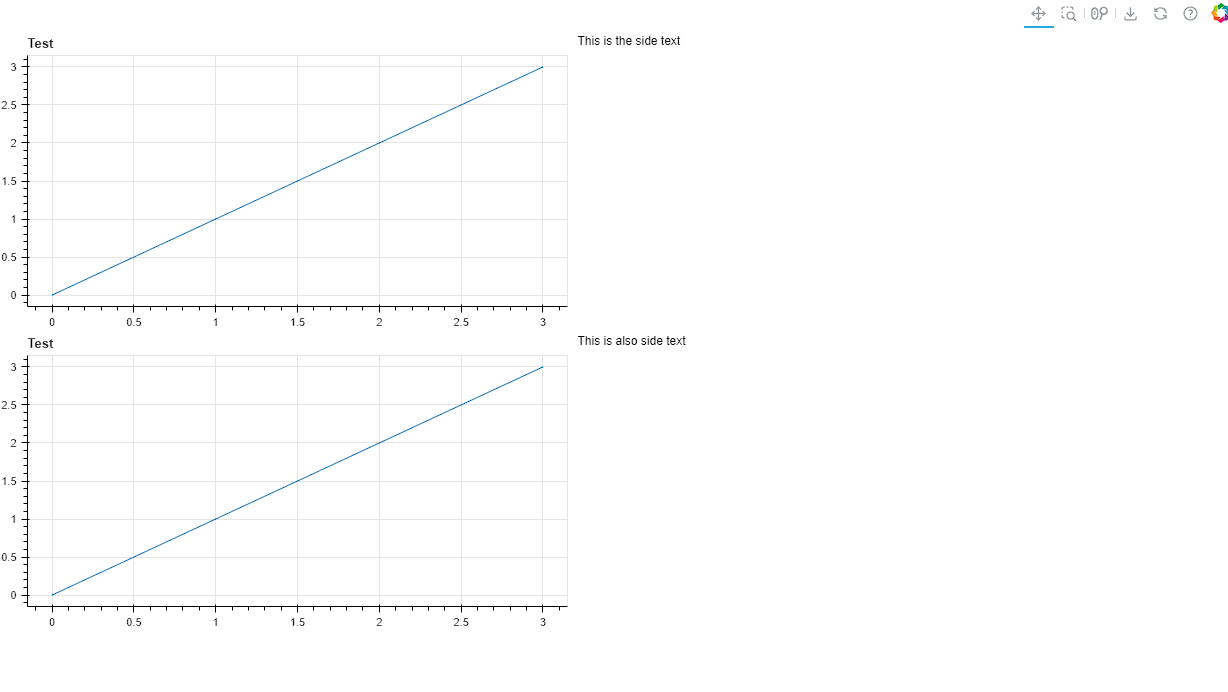
Thanks. That works fine, but what I’m really looking for is more of a grid. I’ve tried a number of approaches, but it really doesn’t come out right. The most sane way that I can see to get there is this code, but it only takes up half the browser width. It does react to window size, though.
from bokeh.plotting import figure, show
from bokeh.layouts import row, column, gridplot
from bokeh.models import Div

data = [0, 1, 2, 3]

p = figure(title="Test", height=300, sizing_mode='stretch_width')
p.line(list(range(4)), data)

p2 = figure(title="Test", height=300, sizing_mode='stretch_width')
p2.line(list(range(4)), data)

d = Div(text='This is the side text', width=200)
d2 = Div(text='This is also side text', width=200)

# r1 = row(p, d)
# r2 = row(p2, d2)
# show(column([r1, r2], sizing_mode='stretch_width'))

show( gridplot([[p,d], [p2,d2]], sizing_mode='stretch_width') )
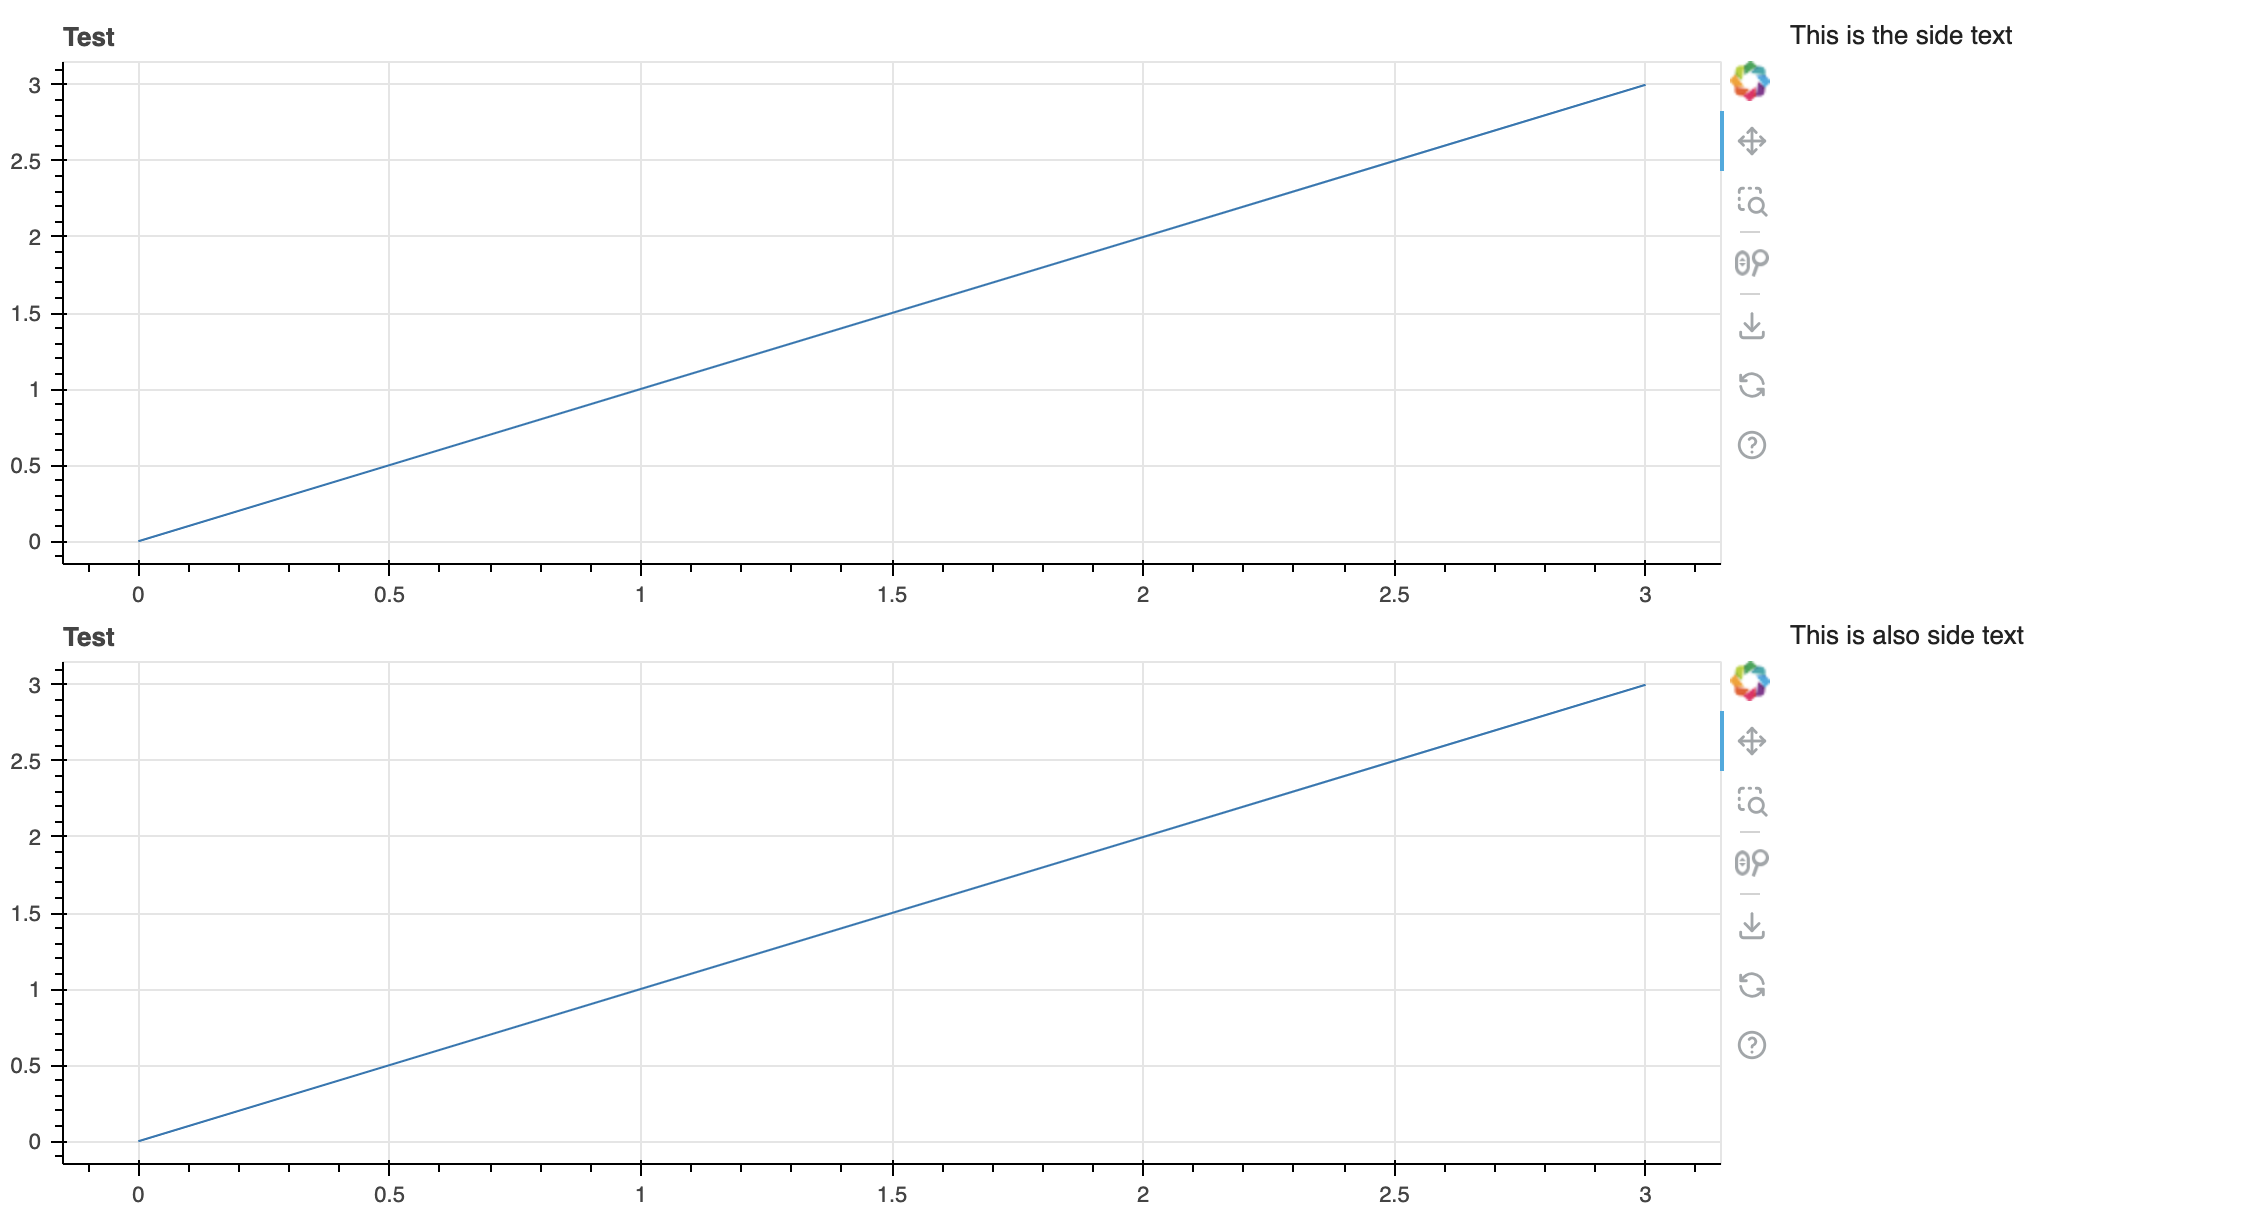
I’m not sure if you can do it with gridplot but the following code with row and columns seems to be what you want, right?
from bokeh.plotting import figure, show
from bokeh.layouts import row, column, gridplot
from bokeh.models import Div

data = [0, 1, 2, 3]

p = figure(title="Test", height=300, sizing_mode='stretch_width')
p.line(list(range(4)), data)

p2 = figure(title="Test", height=300, sizing_mode='stretch_width')
p2.line(list(range(4)), data)

d = Div(text='This is the side text', width=200)
d2 = Div(text='This is also side text', width=200)

show(
    column(
        row(p, d, sizing_mode='stretch_width'),
        row(p2, d2, sizing_mode='stretch_width'),
        sizing_mode='stretch_width'
    )
)