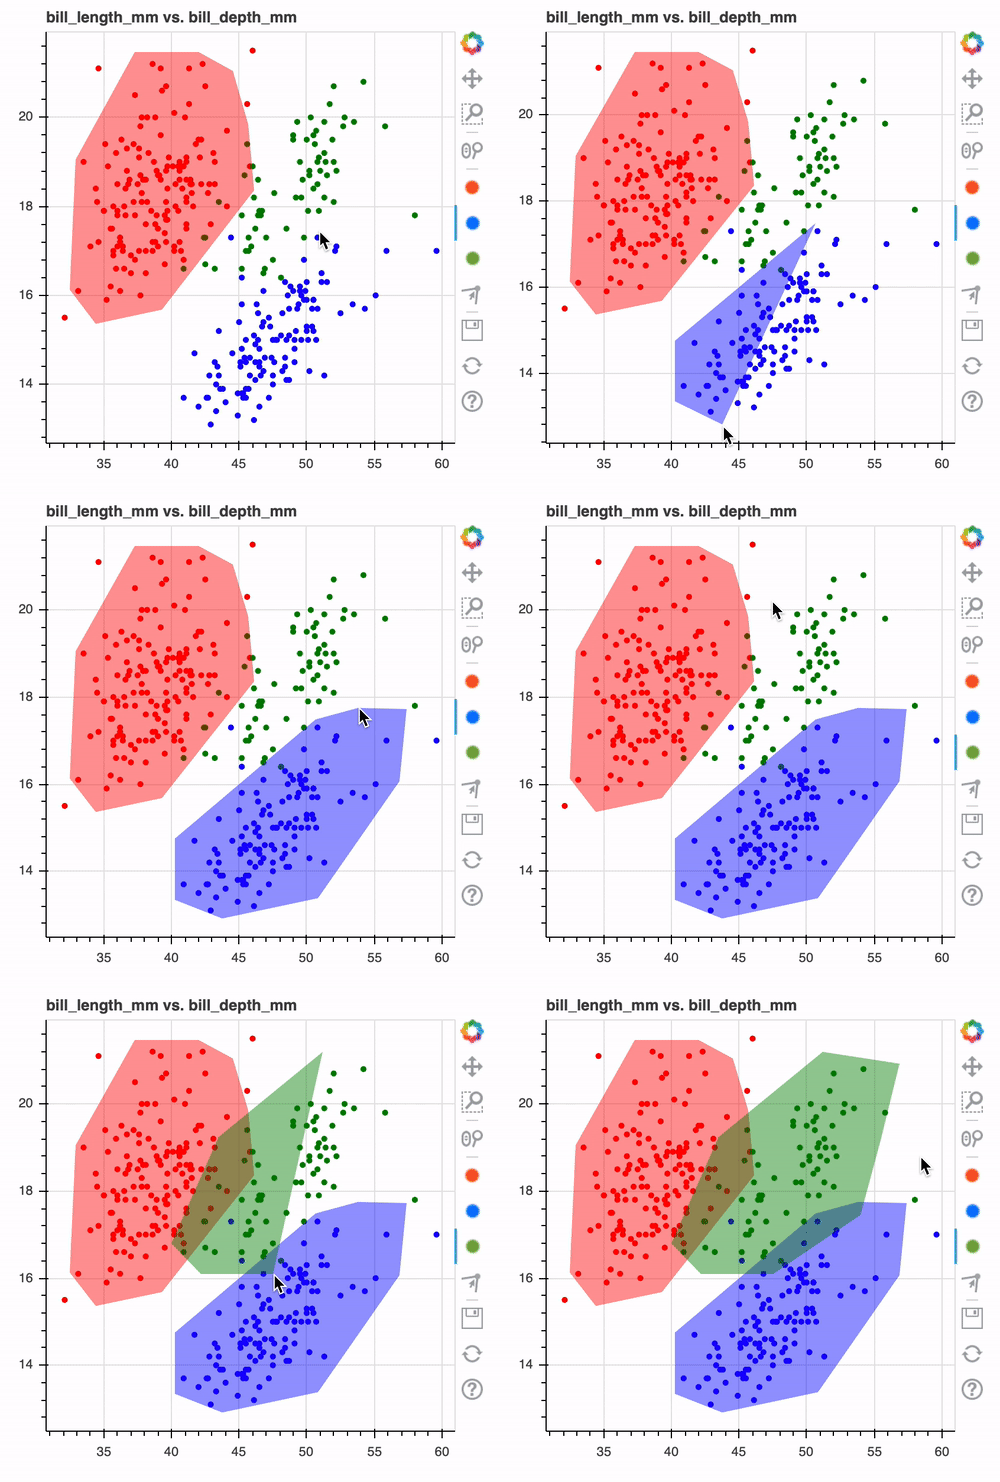
I just gave a talk at PyData Eindhoven where I demonstrated a tool that allows you to … well … draw machine learning models.

The idea is that you can draw a polygon over a dataset. In this case you see one chart but you can have many that are linked. Then we can use a point-in-poly algorithm to determine if a new datapoint falls into a drawn polygon. This is then used to determine what class a new datapoint should be. The resulting object is designed to be scikit-learn compatible which means that we can use domain knowledge more easily as a benchmark.
Currently these drawings can also be used as a featurizer or an outlier detector model but in the future I’ll be adding more support for more interactive elements. What excites me is that this forces the user to also do proper exploratory analysis instead of merely running .fit(X, y).predict(X). Hopefully more folks will try to understand their data before they call it a day.
That said, the main thing I want to mention here is my thanks to @p-himik. While making this tool I hit a serious issue and within a day he helped me with my issue on this forum. Thanks!
