I want to select a point in a scatterplot that changes the input data of a second plot. My CustomJS callback does not work

I have a scatter plot, each point represents a location and is connected to a timeseries of the Resistance measured in that point. I want to make a app where I select a point with the scatterplot on top and the timeseries graph below. If I select a point in the scatterplot, using the tap tool, I want the bottom graph to automatically change.
I was able to do this with a python callback but need it in CustomJS (my aim is to create a dashboard and I have other modules already in CustomJS)
I’m not at liberty to disclose my data yet so below is a simplified version

from bokeh.io import curdoc
from bokeh.layouts import column
from bokeh.models import ColumnDataSource
from bokeh.plotting import figure

# Create data for plot
x = [0, 1, 2]
y = [0, 1, 4]

# Create the plot (this will be clicked on)
plot = figure(height=400, width=600, title='Select a point', tools='tap')
plot_source = ColumnDataSource(data=dict(x=x, y=y))
plot.circle('x', 'y', source=plot_source, size=30)

# Create two sets of data for the graph
master_data = {0: {'x': [0, 1, 2], 'y': [0, 1, 4]},
               1: {'x': [0, 1, 2], 'y': [0, -1, -4]},
               2: {'x': [0, 1, 2], 'y': [0, 2, 8]}}

# Create a graph
data = master_data[0]
graph_source = ColumnDataSource(data)
graph = figure(height=400, width=600, title='Graph', tools='')
graph.line('x', 'y', source=graph_source)


# Here the reactions of the server are defined
def my_tap_handler(attr, old, new):
    index = new[0]
    graph_source.data = master_data[index]


plot_source.selected.on_change("indices", my_tap_handler)
curdoc().add_root(column(plot, graph))

This is the callback I tried but did not work

callback_code = """
    const index = cb_obj.indices[0];
    graph_source.data = master_data[index];
    graph_source.change.emit();
"""
# Create a CustomJS callback using the code
callback = CustomJS(args=dict(graph_source=graph_source, master_data=master_data), code=callback_code)
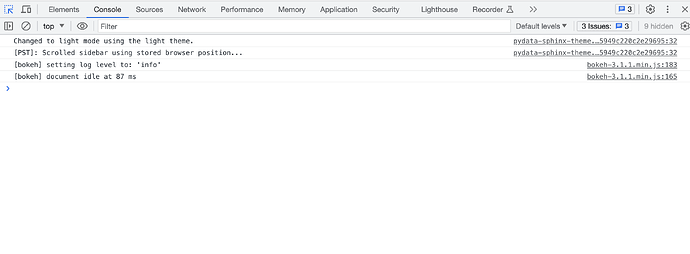
Are there any messages or errors in the browsers JavaScript console?

Hi Brian, no the only thing I can do is tap on a point in the scatterplot but the graph below does not adapt

@loreVanhooren I understand that the graph does not update. I am saying that browsers have a JavaScript console where error and warning messages show up as text logs. It is usually accessible via a “dev tools” menu or similar (every browser is different, I can’t give any more specific instruction). It should look something like:

Can you confirm you have looked at the console and not seen any error or warning messages?

@loreVanhooren Are you using js_on_change for the CustomJS callback?

plot_source.selected.js_on_change("indices", callback)

Also, in your JS code I believe you need to use get for the master_data Map object

graph_source.data = master_data.get(index);

Thanks this works!

FYI: I got the following error in the Javascript console:
Uncaught Error: ColumnDataSource(p1048).data given invalid value: undefined

I think the error is related to master_data is a Map JS object, hence you need to use get

graph_source.data = master_data.get(index);

Could local browser/computer settings attribute to the problem?
The proposed solution worked but when I ran it on a different computer I got some error messages. Changed the callback to master_data[index] and then it worked… weird right?

cheers

@loreVanhooren Good observation! My JS skills are not so good :thinking: I only have FireFox and Safari on a macOS system to test on. However, I have observed one thing: if I change the keys of master_data from integers to strings in the python part where the dictionary is defined then on my system master_data in the code part of CustomJS is a JS Object and not a Map object. I do not know why this is, again my JS skills are letting me down :wink:

master_data = {'0': {'x': [0, 1, 2], 'y': [0, 1, 4]},
               '1': {'x': [0, 1, 2], 'y': [0, -1, -4]},
               '2': {'x': [0, 1, 2], 'y': [0, 2, 8]}}

# Create a graph
data = master_data['0']  # Need to change to string key

Callback code

callback_code = """
    if (cb_obj.indices.length === 0) {
        return;
    }
    console.log(master_data);
    const index = cb_obj.indices[0];
    console.log(typeof index);
    graph_source.data = master_data[index];
    graph_source.change.emit();
"""

In my browser console window I have (the console.log(master_data) entry)

Object { 0: {…}, 1: {…}, 2: {…} }

Forgot to mention that in the JS code you could also use instanceof to check whether master_data is a Map type object or not

if (master_data instanceof Map) {
  ...
} else {
  ...
}

This topic was automatically closed 90 days after the last reply. New replies are no longer allowed.