I want to use hover(tooltips), but unexpected result appear

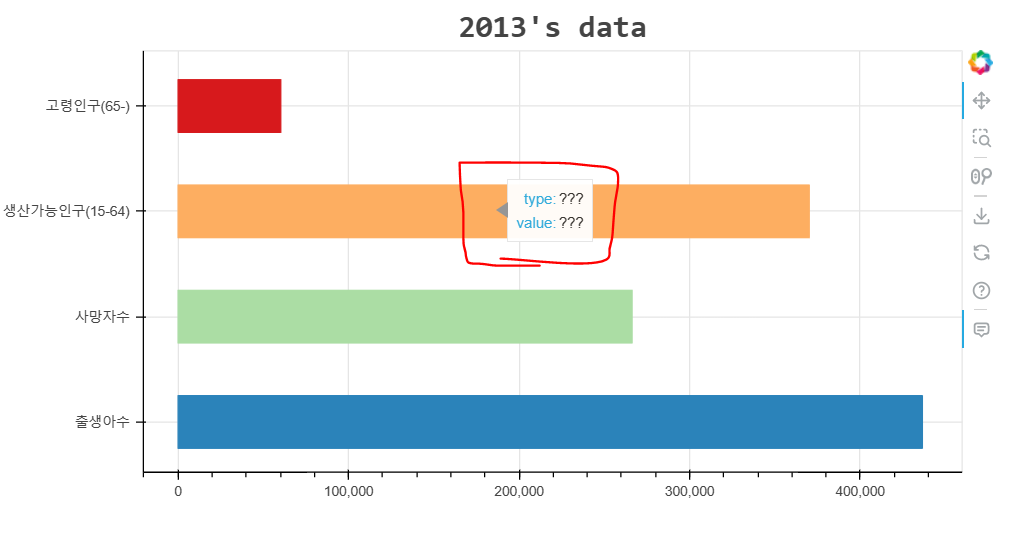
hello. I am in the process of creating an hbar. I tried to use tooltips so that the y value and the right value of the hbar come out when I hover over the graph, but as shown in the picture, type:??? value:??? is displayed, so I tried using hover, but it’s the same. If so, what should I do? The bokeh version is 3.1.0. Any help would be greatly appreciated.
Thank you for help me.

import pandas as pd
from bokeh.plotting import figure, output_file, show
from bokeh.models import ColumnDataSource, HoverTool, Title
from bokeh.palettes import Spectral4
import csv
with open('./lecturespace/2013data.csv') as f:
    reader = csv.reader(f)
    for row in reader:
        if len(row) == 0 or row[0][0] == '#':
            continue
        else:
            print(row)
type = []
value = []
with open('./lecturespace/2013data.csv') as f:
    reader = csv.reader(f)
    for column in reader:
        if len(column) == 0 or column[0][0] == '#':
            continue
        else:
            type.append(str(column[0]))
            value.append(int(column[1]))
from bokeh.models import BasicTickFormatter
from bokeh.models import NumeralTickFormatter

xformatter = NumeralTickFormatter(format="0,0")
p=figure(y_range=type,title=Title(text="2013's data", align="center", text_font_size = "25px",text_font="Consolas", 
        text_font_style="bold"), height=400, width=800,tooltips=tooltips)

colors = {'출생아수': Spectral4[0], '사망자수': Spectral4[1], '생산가능인구(15-64)': Spectral4[2], '고령인구(65-)': Spectral4[3]}
color_list = [colors[t] for t in type]

p.xaxis.formatter = BasicTickFormatter(use_scientific=False)    
p.xaxis.formatter = xformatter                                  

hover = p.select(dict(type=HoverTool))
formatters={'@index1': 'type','@index2' : 'value'}
hover.tooltips = [('type', '@index1'), ('value', '@index2')]

p.hbar(y=type, right=value,height=0.5,color=color_list)
show(p)

This is my csv file data when I run print(row)
[‘출생아수’, ‘436500’]
[‘사망자수’, ‘266257’]
[‘생산가능인구(15-64)’, ‘370140’]
[‘고령인구(65-)’, ‘60230’]
beacuase of new user’s policy, There is one image.

The ??? from hover means the field is missing from the data source. The default data source that Bokeh constructs when you pass directly to a glyph only contains the coordinates (i.e. y and right in this case). You need to configure an explicit ColumnDataSource for the glyph, and make sure you add the the “index1” and “index2” columns to it:

https://docs.bokeh.org/en/latest/docs/user_guide/basic/data.html#providing-data-as-a-columndatasource

hmm… Thank you.
Then, should I make a plot using a column datasource rather than a file reader method? I tried making a dic from my existing code and it still gives me ???. But when using columndatasource, the graph is not displayed on the web and only a white screen appears. So i will definitely use the file reader method.

df = pd.read_csv('./lecturespace/2013data.csv', comment='#', header=None, names=['type', 'value'])
source = ColumnDataSource(df)
my_dict = dict(
    type=df['type'],
    value=df['value']
)
hover = HoverTool(
    tooltips=[
        ('Type', '@my_dict'),
        ('Value', '@my_dict')
    ]
)
p.add_tools(hover)

I just added this code to the code I posted. But still ??? came out…
txs…

oh i solve that

import pandas as pd
from bokeh.plotting import figure, output_file, show
from bokeh.models import ColumnDataSource, HoverTool, Title
from bokeh.palettes import Spectral4
import csv
from bokeh.models import BasicTickFormatter, NumeralTickFormatter
from bokeh.layouts import gridplot

with open('./lecturespace/2013data.csv') as f:
    reader = csv.reader(f)
    birth_death_data = []
    age_data = []
    for row in reader:
        if len(row) == 0 or row[0][0] == '#':
            continue
        if row[0] == '출생아수' or row[0] == '사망자수':
            birth_death_data.append(row)
        elif row[0] == '생산가능인구(15-64)' or row[0] == '고령인구(65-)':
            age_data.append(row)

birth_death_df = pd.DataFrame(birth_death_data, columns=['type', 'value'])
age_df = pd.DataFrame(age_data, columns=['type', 'value'])

birth_death_source = ColumnDataSource(birth_death_df)
age_source = ColumnDataSource(age_df)
xformatter = NumeralTickFormatter(format="0,0")
p1 = figure(y_range=birth_death_df['type'], title=Title(text="2013년 출생아 수 사망자 수", align="center", text_font_size="25px", text_font="Consolas", text_font_style="bold"), height=500, width=500)
p1.hbar(y='type', right='value', height=0.3, color=Spectral4[0], source=birth_death_source)
p1.xaxis.formatter = NumeralTickFormatter(format="0,0")
p1.xaxis.formatter = xformatter
p1.add_tools(HoverTool(tooltips=[("Type", "@type"), ("Value", "@value")]))

p2 = figure(y_range=age_df['type'], title=Title(text="2013년 생산가능 인구와 고령인구 수(단위 : 백 명)", align="center", text_font_size="25px", text_font="Consolas", text_font_style="bold"), height=500, width=500)
p2.hbar(y='type', right='value', height=0.3, color=Spectral4[1], source=age_source)
p2.xaxis.formatter = NumeralTickFormatter(format="0,0")
p2.xaxis.formatter = xformatter
p2.add_tools(HoverTool(tooltips=[("Type", "@type"), ("Value", "@value")]))

layout = gridplot([[p1, p2]])

show(layout)

This topic was automatically closed 90 days after the last reply. New replies are no longer allowed.