I had to remove my db calls, and the ‘dynamic’ data so I put some random data, just for the sake of the example:
import random
from bokeh.plotting import figure, output_file, show, ColumnDataSource
from bokeh.models import HoverTool
from collections import OrderedDict
hover = HoverTool()
hover.tooltips = OrderedDict([
(“Language”, “@c”),
(“Location”, “$x, $y”),
])
languages = [‘English’, ‘French’, ‘German’, ‘Italian’]
colors = [‘coral’, ‘brown’, ‘blue’, ‘green’, ‘black’,
‘red’, ‘purple’, ‘orange’, ‘grey’, ‘lightblue’]
p = figure(plot_width=1000, plot_height=800, title=“Languages”,
x_axis_label=‘x’, y_axis_label=‘%’, tools=[hover])
x = [x for x in xrange(30)]
output_file(“languages.html”, title=“Languages”)
for language in languages:
y = [random.uniform(1, 100) for i in xrange(30)]
source = ColumnDataSource(
    data=dict(
        x=x,
        y=y,
        c=[language] * len(x),
        )
    )

p.line('x', 'y', legend=str(language), x_axis_type="date",
       line_width=3, line_color=colors.pop(),  source=source)
del y
show(p)
Best,
piqo
···
On Saturday, June 13, 2015 at 12:49:11 AM UTC+2, Sarah Bird wrote:
Hey, that looks great - if you’re able to post the code or a working notebook that would be awesome!
On Fri, Jun 12, 2015 at 8:53 PM, piqo [email protected] wrote:
Thank you folks for responding so quickly.
@Sarah
I didn’t have any issue with the dynamically generated legend. But making it a list would throw an exception:
File “/usr/local/lib/python2.7/dist-packages/bokeh/_glyph_functions.py”, line 73, in func
legends.setdefault(legend_name, []).append(glyph_renderer)
File “/usr/lib/python2.7/collections.py”, line 148, in setdefault
if key in self:
TypeError: unhashable type: ‘list’
Anyways, the solution I derived from your comments was the following:
__ source = ColumnDataSource(
data=dict(
x=x,
y=y,
c=[language] * len(x),
)
)__
But I agree, there should be something more elegant than this solution.
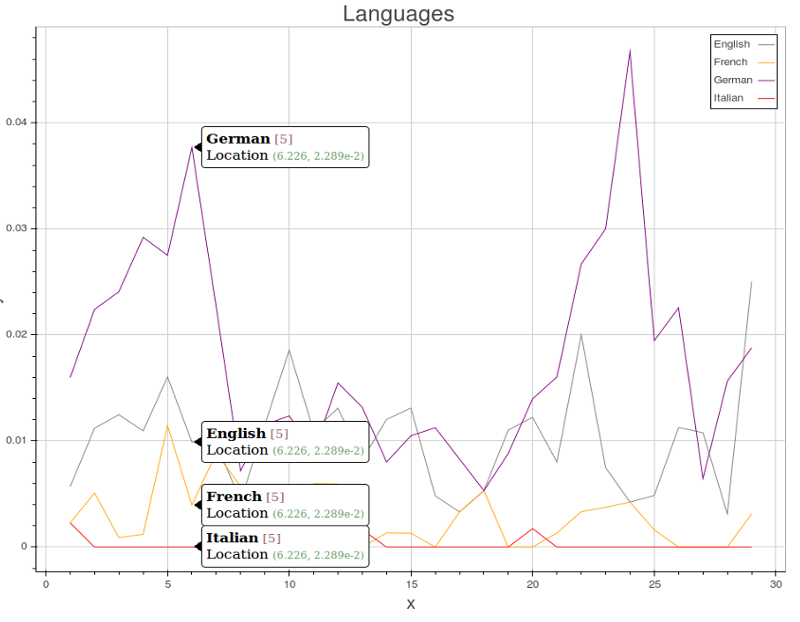
Attached screen-shot of working example.
Thanks for your help,
Piqo
On Friday, June 12, 2015 at 1:37:42 AM UTC+2, Sarah Bird wrote:
Legend probably won’t, sorry, it’s late, I shouldn’t be answering questions!
Re: multi_line - I think you’re right that hover doesn’t work. I may have a quick poke, as I’m poking - https://github.com/bokeh/bokeh/issues/2376
On Fri, Jun 12, 2015 at 12:30 AM, Bryan Van de Ven [email protected] wrote:
Is this documented anywhere? I’m not sure why it should work offhand.
Bryan
On Jun 11, 2015, at 6:26 PM, Sarah Bird [email protected] wrote:
Try:
p.line(‘x’, ‘y’, legend=[str(language)], size=10, line_color=colors.pop(), source=source)
And you definitely want @ as the prefix for all the fields.
Cheers,
Bird
On Thu, Jun 11, 2015 at 11:00 PM, piqo [email protected] wrote:
Hi,
How do I show the line name (language variable, in my case) when hovering on a line chart?
Using hover, I can see X, and Y values, but no line name (indicator). It simply shows ??? (or when I use @language it shows single characters of the language names)
My hover is:
languages = [‘English’, ‘German’, ‘Portugese’]
hover = HoverTool(
tooltips = """
<div>
<span>$language</span>
<span>[$index]</span>
</div>
<div>
<span>Location</span>
<span>($x, $y)</span>
</div>
"""
)
for language in languages:
# I fill here x, y lists with data for each language appropriately...
source = ColumnDataSource(
data=dict(
x=x,
y=y,
language=language,
)
)
p.line('x', 'y', legend=str(language), size=10, line_color=colors.pop(), source=source)
–
You received this message because you are subscribed to the Google Groups “Bokeh Discussion - Public” group.
To unsubscribe from this group and stop receiving emails from it, send an email to [email protected].
To post to this group, send email to [email protected].
To view this discussion on the web visit https://groups.google.com/a/continuum.io/d/msgid/bokeh/71a2ed03-eb26-4e79-858d-abfcd428481a%40continuum.io.
For more options, visit https://groups.google.com/a/continuum.io/d/optout.
–
You received this message because you are subscribed to the Google Groups “Bokeh Discussion - Public” group.
To unsubscribe from this group and stop receiving emails from it, send an email to [email protected].
To post to this group, send email to [email protected].
To view this discussion on the web visit https://groups.google.com/a/continuum.io/d/msgid/bokeh/CA%2BEr%2BdRLSXDQVYZutw3JQSEAJo%3DEHFRJPLKaxN%3DO_U-NJNqh1g%40mail.gmail.com.
For more options, visit https://groups.google.com/a/continuum.io/d/optout.
–
You received this message because you are subscribed to the Google Groups “Bokeh Discussion - Public” group.
To unsubscribe from this group and stop receiving emails from it, send an email to [email protected].
To post to this group, send email to [email protected].
To view this discussion on the web visit https://groups.google.com/a/continuum.io/d/msgid/bokeh/1C7489F5-90E5-48F6-A10D-D0DA155A58A6%40continuum.io.
For more options, visit https://groups.google.com/a/continuum.io/d/optout.
–
You received this message because you are subscribed to the Google Groups “Bokeh Discussion - Public” group.
To unsubscribe from this group and stop receiving emails from it, send an email to [email protected].
To post to this group, send email to [email protected].
To view this discussion on the web visit https://groups.google.com/a/continuum.io/d/msgid/bokeh/661416b3-79c3-4e35-a8d9-bd98eb594460%40continuum.io.
For more options, visit https://groups.google.com/a/continuum.io/d/optout.