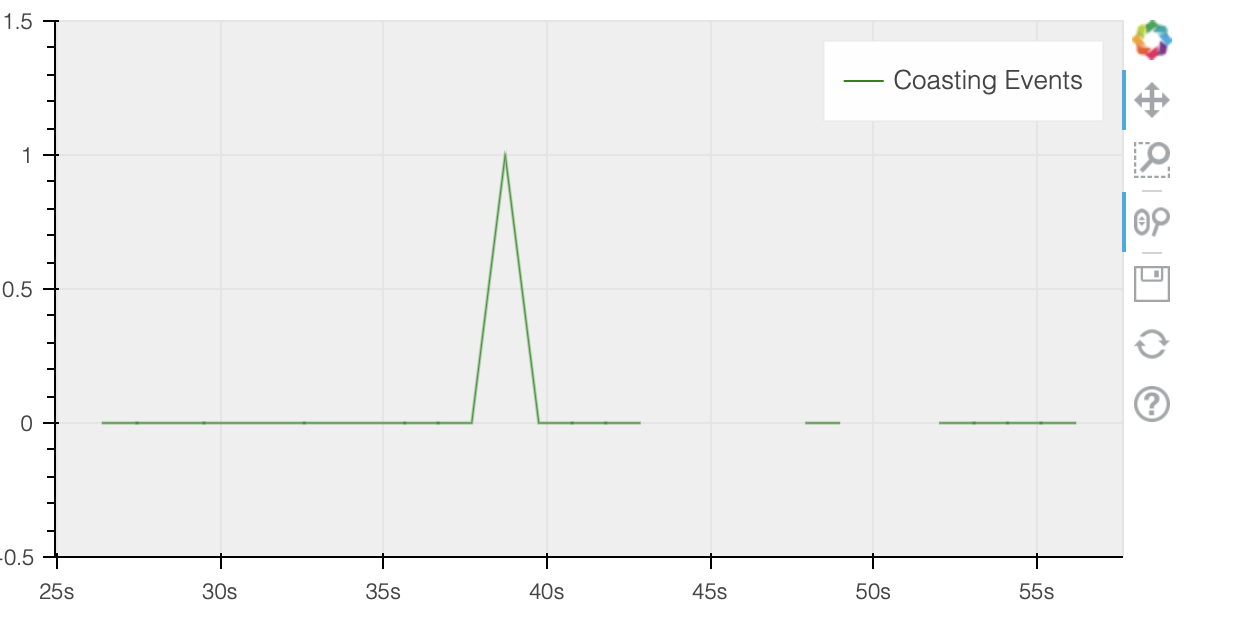
I am building a dashboard using bokeh and occasionally the line plot shows gaps. These seem to be related to the fact that not every new point arrives with the same interval (some of them are every 1 second, but sometimes they arrive every 2). I would expect the same behavior, but with the line joining all points.
To update the plot I am doing:
ROLLOVER = 30
# df has one row
source.stream(df.to_dict(orient="list"), ROLLOVER)
Hi @danski3456 There’s not really enough information here to speculate. The most efficient way to take advantage of the expertise here is to provide a Minimal Reproducible Example. When code can be run and investigated directly, it’s often possible to diagnose a usage problem (or bug) almost immediately. Also, please always provide relevant version information for your setup.