Hi, I just want to point out something I just ran into.
There is a heatmap type plot I am trying to make. My original plan was to use the Image glyph because it’s fast and the hovertool options now available for it are exactly what I need.
However, the wrench in it is that the figure I am plotting it on has an log scaled axis. I wondered how the image glyph would behave:
import numpy as np
from bokeh.plotting import figure, output_notebook,show
from bokeh.models import HoverTool

output_notebook()
img = np.arange(50).reshape(5,10)
# img2 = np.random.rand(10,5)
img2 = np.arange(50).reshape(5,10)
hover = HoverTool(tooltips=[
    ('index', '$index'),
    ('x','$x'),('y','$y')
    ,('image','@image')])

p = figure(plot_width=400,plot_height=400,tools=[hover]
           ,x_axis_type='log'
          )
p.image(image=[img,img2],x=[0,10],y=[0,10],dw=[10,90],dh=[5,10],palette='Viridis256')
show(p)
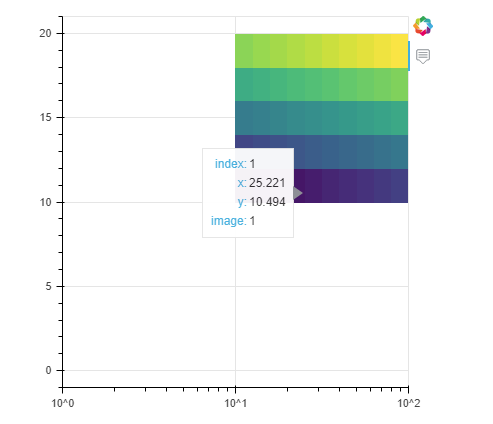
What happens is that the image anchors in the correct place and stretches over the right bounds, but the pixels all have the same widths… which is basically how an image should behave and I understand why. But, it is wrong/misleading in terms of displaying the data on the plot, as really… the colors should not be evenly spaced here. There are no warnings for this etc.
The two solutions I’ve identified are
- resample the heatmap image to the smallest pixels only (pain in the butt)
- use Quad glyph instead (slower but probably easier to implement)
Just thought I’d mention this in case anyone has anything to add, or to at least post something here “warning” about this behaviour.