Hi,
I’m trying to create this effect: Custom Overlays | Maps JavaScript API | Google Developers using Bokeh. See code below. It all seems to work fine, except that when I open the gmap_plot.html file I see the image flashing and being immediately replaced by the original google map. If I understand it correctly, this means that the map is being written on top of the image, despite the fact that I’m explicitly setting the level to ‘image’. This seems to only happen with image overlays, as I do the same thing with a Circle and it shows up fine. The order in which the Circle and ImageURL are added to the plot seems to not make a difference.
I’m using:
Bokeh 0.12.7
Python 3.5.2 :: Anaconda 4.2.0 (x86_64)
OSX 10.12.6
from bokeh.io import output_file, show
from bokeh.models import (
GMapPlot, GMapOptions, ColumnDataSource, Circle, DataRange1d, PanTool, WheelZoomTool, BoxSelectTool
)
from bokeh.models.glyphs import ImageURL
from bokeh.plotting import figure
map_options = GMapOptions(lat=62.323907, lng=-150.109291, map_type=“roadmap”, zoom=11)
fig = figure()
plot = GMapPlot(
x_range=DataRange1d(), y_range=DataRange1d(), map_options=map_options
)
plot.api_key = “GOOGLE_MAPS_API_KEY”
source = ColumnDataSource(
data=dict(
lat=[40.4774],
lon=[-74.2589],
)
)
source2 = ColumnDataSource(
data=dict(
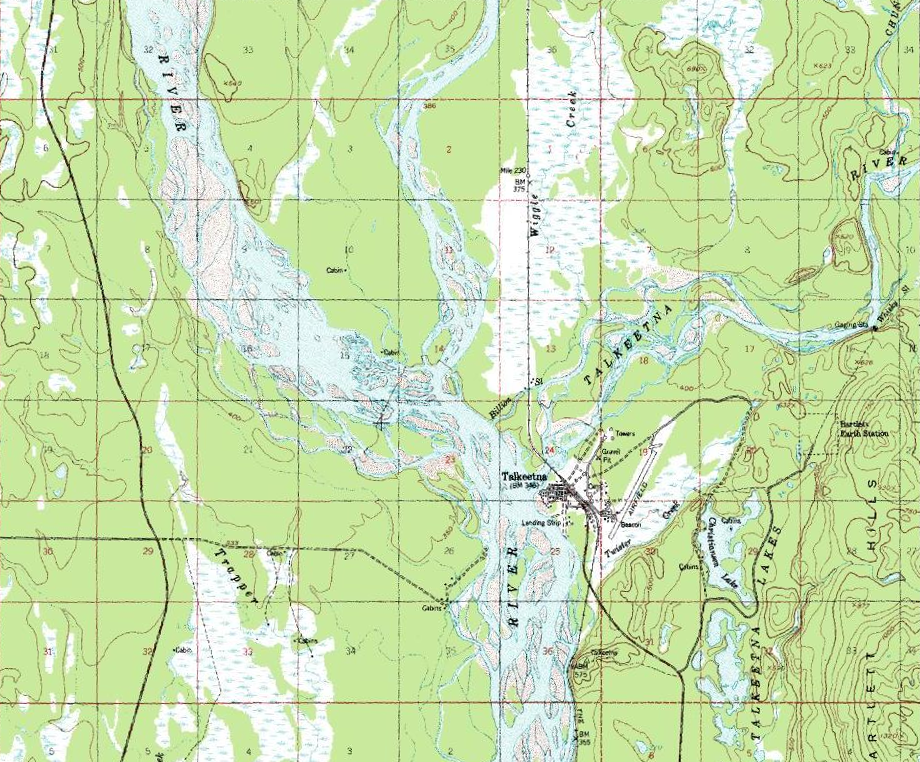
url=[“https://developers.google.com/maps/documentation/javascript/examples/full/images/talkeetna.png”],
x=[-150.287132],
y=[62.281819],
dx=[0.281524],
dy=[0.118652]))
circle = Circle(x=“x”, y=“y”, size=15, fill_color=“blue”, fill_alpha=0.8, line_color=None)
plot.add_glyph(source2, circle, level=‘image’)
img = ImageURL(url=‘url’, x=‘x’, y=‘y’, w=‘dx’, h=‘dy’, anchor=‘bottom_left’)
plot.add_glyph(source2, img, level=‘image’)
plot.add_tools(PanTool(), WheelZoomTool(), BoxSelectTool())
output_file(“gmap_plot.html”)
show(plot)
Screenshot:

Maybe there is something obvious I’m missing? Any ideas? Any help would be greatly appreciated!
Best,
Bruno