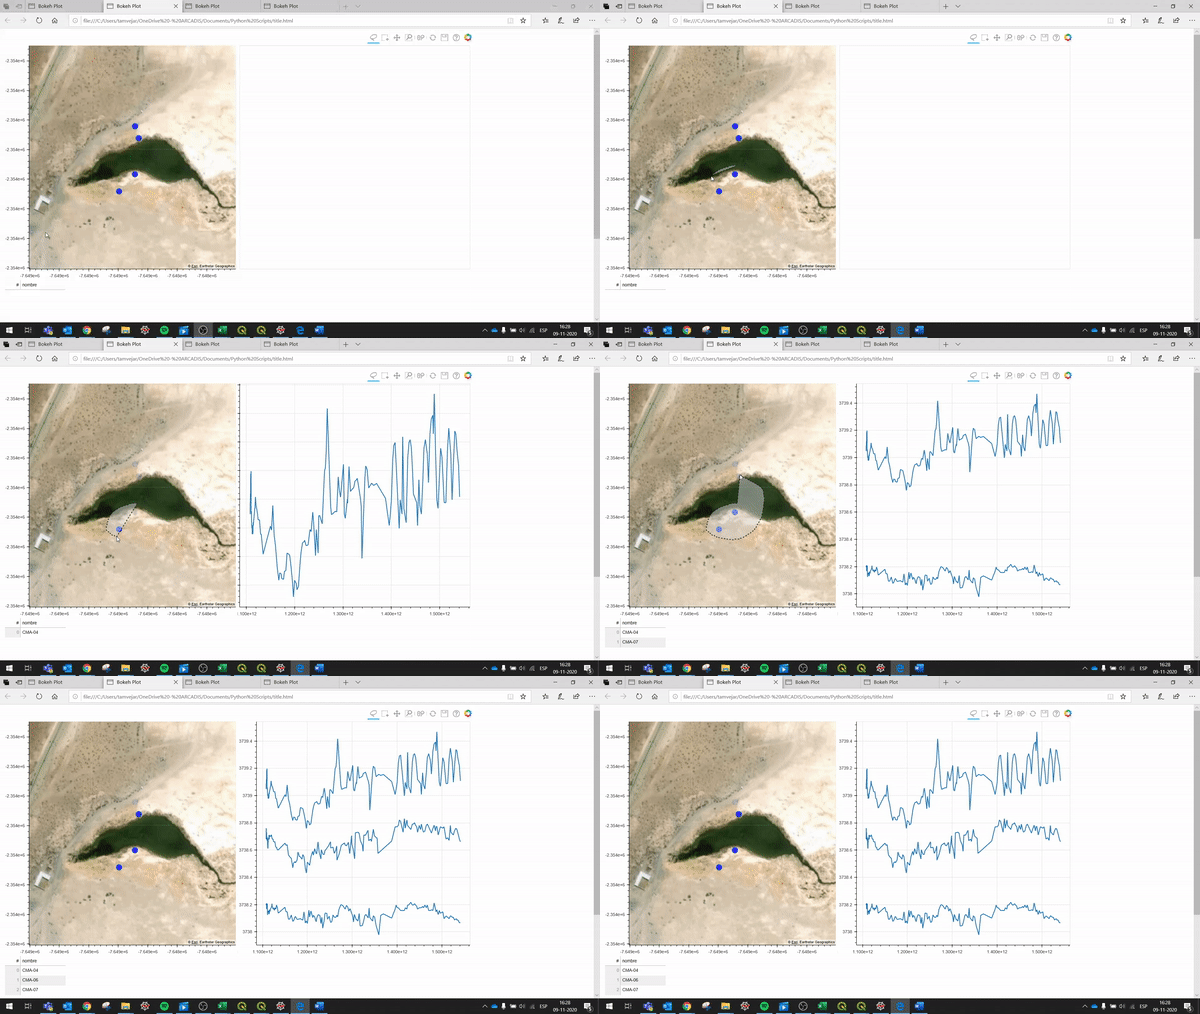
I’m a new user of Bokeh and I’m trying to create an interactive map where by enclosing a certain set of points with the lasso tool, a chart is generated with various time series data of a certain variable (for example, concentration of an element in time). The operation of the code is shown in the image

The problem I have in my approach is that I only have a data source that is updated based on the elements that are enclosed and in the chart I only have an associated line, so I cannot change the properties (colors, labels, etc.) of the line, because, in theory it is only one. In this sense, what the “callback” does at the moment is to obtain the points enclosed by the lasso and, for each one of them, it selects the data x, y to generate the chart and saves it in a ColumnDataSource that is used for the chart the time series. I imagine that the correct approach should be to generate a line for each point enclosed by the lasso, but I haven’t found how yet.
The callback code is as follows:
source.selected.js_on_change(‘indices’, CustomJS(args=dict(source=source,data_source=data_source,s2=s2, source2=source2), code=“”"
//source: contains the data of the points
//data_source: contains the time series data from each point
//s2: save the name of the points selected
//source2: saves the time series data from each selected point//Lasso event var inds = cb_obj.indices; var d1 = source.data; var d2 = s2.data; d2['nombre'] = [] for (var i = 0; i < inds.length; i++) { d2['nombre'].push(d1['nombre'][inds[i]]) } s2.change.emit(); //Chart event var data = data_source.data; var s_data = source2.data; var letter = data['Pozo']; var select_vals = s2.data['nombre']; var x_data = data['Fecha']; var y_data = data['Cota NE (msnm)']; var x = s_data['x']; x.length = 0; var y = s_data['y']; y.length = 0; for (var i = 0; i < x_data.length; i++) { if (select_vals.indexOf(letter[i]) >= 0) { x.push(x_data[i]); y.push(y_data[i]); } } source2.change.emit();“”"))
plot = figure()
plot.line(‘x’, ‘y’, line_width = 2, source = source2)