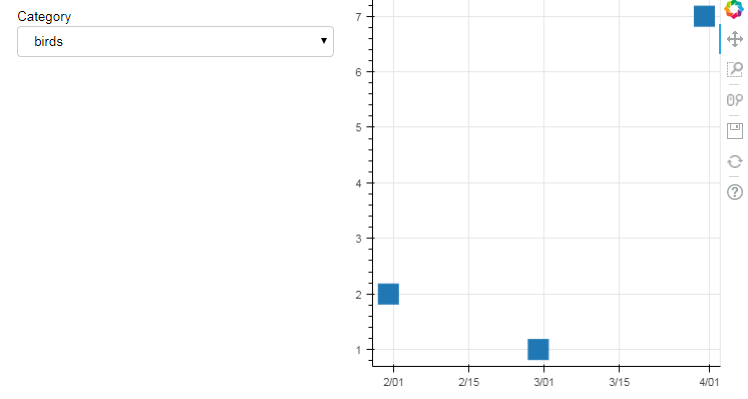
Hello,
I’m running an app on Bokeh Server. By changing the value of a dropdown, I’m changing the group value in a CDSView object. I expected the glyph that uses this view to change as well, but it doesn’t. Could someone explain why the glyph isn’t updating?
Info:
Python 3.6.3
Bokeh 0.12.13
Pandas 0.22.0
Chrome 64.0.3282.186 (64-bit)
Windows 7 (64-bit)
Code:
import pandas as pd

from bokeh.layouts import row, widgetbox
from bokeh.models.widgets import Select
from bokeh.plotting import curdoc, figure
from bokeh.models import ColumnDataSource, CDSView, GroupFilter

df = pd.DataFrame({
        'category': ['birds', 'birds', 'birds', 'cats', 'cats', 'cats'],
        'value': [2, 1, 7, 6, 10, 4],
        'date': pd.date_range(start='1/1/2018', periods=6, freq='M')
        })

source = ColumnDataSource(df)

view = CDSView(source=source,
               filters=[GroupFilter(column_name='category', group='birds')])

p = figure(x_axis_type='datetime')

square = p.square('date', 'value', source=source, view=view, size=20)

def update(attr, old, new):
    view.filters[0].group = cats.value

cats = Select(title='Category', value='birds',
              options=['birds', 'cats'])

cats.on_change('value', update)

widgets = widgetbox([cats])

r = row([widgets, p], sizing_mode="scale_width")

curdoc().add_root(r)
curdoc().title = "test"
Result:

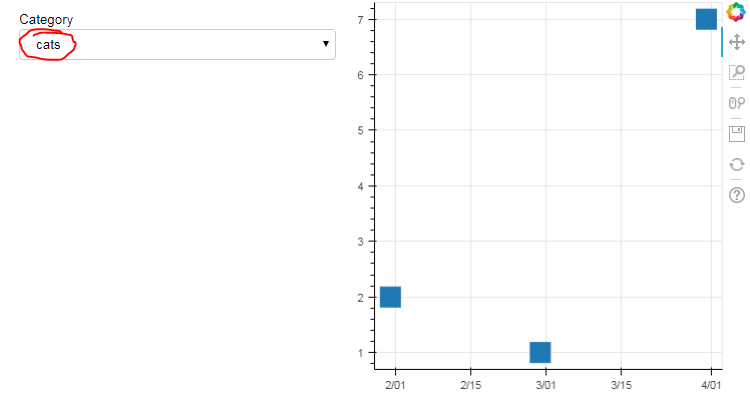
Changing the dropdown value from “birds” to “cats” appears to change the CDSview correctly (I have verified this with print statements in my update function). But the graph doesn’t change:
