Interactions in a Chordal graph with bokeh

Hi all !

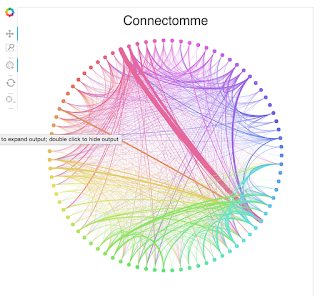
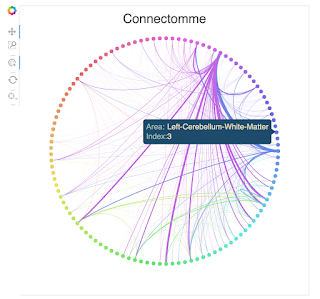
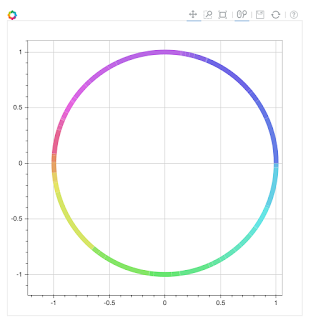
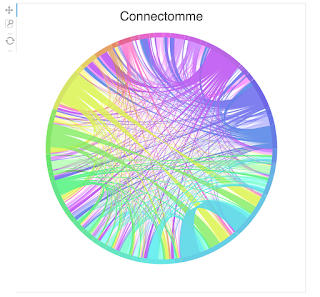
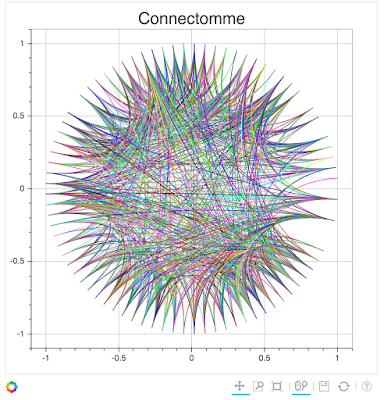
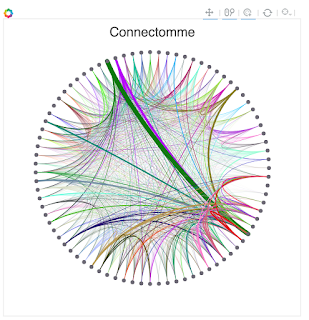
My name is Gabi, I’m a medical student trying to create an interactive representation of connectomes (“wires of the brain”). I though that making it with Bokeh would let me generate them on the fly or even create HTML reports that I could share online. I’ve been working intensively with Bokeh for a couple of week so far, here is the evolution of the project:

Right now the graph is composed of arcs and bezier curves. The main Idea, now that the glyphs have been generated, is adding some interaction to them. I wanted to use the hover tool to show information about the glyphs (the arcs) and tap (on the arcs too) for styling the bezier curves, like alpha=0.

I’ve seen that hover tool is not working on arcs right now, so i thought that tapping could make it, even if I had to implement it in JS.

I’ve tried reading from documentation, modifying examples and looking in Stack Overflow, but I haven’t manage to get it working. So here are my questions and I hope someone can help me:

  • Does ‘tap’ work in arcs?
  • If yes, how can I modify a style of other dataSourceColumn like the beziers ?
  • If no, is there any hack I can try ?
    Some stats, In the first connectome I was creating more than 7.000 beziers, in the last graph, the amazing amount of 76.379 Bokeh rocks!!!

Thanks!!

Gabi

Gabriel,

First, these are great looking charts!

To answer your questions: Arc, Quadratic, Bezier glyphs do not currently implement "hit testing" for points, which is why tap and hover interactions do not work with them. To add hit testing for points, these glyphs would need to get a "_hit_point" method added, similar to this one for the Quad renderer:

  https://github.com/bokeh/bokeh/blob/master/bokehjs/src/coffee/renderer/glyph/quad.coffee#L32

This function gets a "geometry" object that describes the location of the point to hit test against, and returns the indices of which glyphs were hit by that point. BokehJS does have a spatial index (rbush) available to help make hit testing more efficient, but it would be OK to start with a "brute force" implementation, I think. If you'd like to help try to add this capability for some or all of these glyphs that would certainly be appreciated, and we could help answer any questions along the way.

Thanks,

Bryan

···

On Sep 30, 2015, at 1:30 PM, [email protected] wrote:

Hi all !

My name is Gabi, I'm a medical student trying to create an interactive representation of connectomes ("wires of the brain"). I though that making it with Bokeh would let me generate them on the fly or even create HTML reports that I could share online. I've been working intensively with Bokeh for a couple of week so far, here is the evolution of the project:

Right now the graph is composed of arcs and bezier curves. The main Idea, now that the glyphs have been generated, is adding some interaction to them. I wanted to use the hover tool to show information about the glyphs (the arcs) and tap (on the arcs too) for styling the bezier curves, like alpha=0.

I've seen that hover tool is not working on arcs right now, so i thought that tapping could make it, even if I had to implement it in JS.

I've tried reading from documentation, modifying examples and looking in Stack Overflow, but I haven't manage to get it working. So here are my questions and I hope someone can help me:

  • Does 'tap' work in arcs?
  • If yes, how can I modify a style of other dataSourceColumn like the beziers ?
  • If no, is there any hack I can try ?
Some stats, In the first connectome I was creating more than 7.000 beziers, in the last graph, the amazing amount of 76.379 Bokeh rocks!!!!

Thanks!!
Gabi

--
You received this message because you are subscribed to the Google Groups "Bokeh Discussion - Public" group.
To unsubscribe from this group and stop receiving emails from it, send an email to [email protected].
To post to this group, send email to [email protected].
To view this discussion on the web visit https://groups.google.com/a/continuum.io/d/msgid/bokeh/ba187b3e-5c95-4d83-bd78-8b48b00678f0%40continuum.io\.
For more options, visit https://groups.google.com/a/continuum.io/d/optout\.

Gabi, these are gorgeous and awesome!

Would love to see some of these in the bokeh examples and gallery!

-Peter

Lovely stuff!!

···

On Mon, Oct 5, 2015 at 4:10 AM Peter Wang [email protected] wrote:

Gabi, these are gorgeous and awesome!

Would love to see some of these in the bokeh examples and gallery!

-Peter

You received this message because you are subscribed to the Google Groups “Bokeh Discussion - Public” group.

To unsubscribe from this group and stop receiving emails from it, send an email to [email protected].

To post to this group, send email to [email protected].

To view this discussion on the web visit https://groups.google.com/a/continuum.io/d/msgid/bokeh/CABGrp%2B-bvB3zx4L%3DXuZ3Su9PrYrU7D71MLMXXEkX7Hkf%2B2z3Rg%40mail.gmail.com.

For more options, visit https://groups.google.com/a/continuum.io/d/optout.

Thanks Bryan, pwang and Damian!

Thanks for the tip, I’ll start a PR with the modifications to add _hit_point to arc’s first. I don’t know coffescript at all, but i’ll do my best, I hope you can correct any strange thing I do.

Once finished, I was thinking on implementing the graph in the charting interface as all it needs right know is a n-dimensional symmetric array.

Thanks for your help, I hope to see some support on my PR as CS is not my background,

Bests

Gabi

···

On Wednesday, September 30, 2015 at 11:27:12 PM UTC+2, Gabriel de Maeztu wrote:

Hi all !

My name is Gabi, I’m a medical student trying to create an interactive representation of connectomes (“wires of the brain”). I though that making it with Bokeh would let me generate them on the fly or even create HTML reports that I could share online. I’ve been working intensively with Bokeh for a couple of week so far, here is the evolution of the project:

Right now the graph is composed of arcs and bezier curves. The main Idea, now that the glyphs have been generated, is adding some interaction to them. I wanted to use the hover tool to show information about the glyphs (the arcs) and tap (on the arcs too) for styling the bezier curves, like alpha=0.

I’ve seen that hover tool is not working on arcs right now, so i thought that tapping could make it, even if I had to implement it in JS.

I’ve tried reading from documentation, modifying examples and looking in Stack Overflow, but I haven’t manage to get it working. So here are my questions and I hope someone can help me:

  • Does ‘tap’ work in arcs?
  • If yes, how can I modify a style of other dataSourceColumn like the beziers ?
  • If no, is there any hack I can try ?
    Some stats, In the first connectome I was creating more than 7.000 beziers, in the last graph, the amazing amount of 76.379 Bokeh rocks!!!

Thanks!!

Gabi

Gabi,

Awesome! Let us know any questions or help we can give. Best place to start is here:

  http://bokeh.pydata.org/en/latest/docs/dev_guide/building.html

Which details how to build Bokeh from a source checkout.

Bryan

···

On Oct 6, 2015, at 3:22 AM, Gabriel de Maeztu <[email protected]> wrote:

Thanks Bryan, pwang and Damian!

Thanks for the tip, I'll start a PR with the modifications to add _hit_point to arc's first. I don't know coffescript at all, but i'll do my best, I hope you can correct any strange thing I do.
Once finished, I was thinking on implementing the graph in the charting interface as all it needs right know is a n-dimensional symmetric array.

Thanks for your help, I hope to see some support on my PR as CS is not my background,

Bests
Gabi

On Wednesday, September 30, 2015 at 11:27:12 PM UTC+2, Gabriel de Maeztu wrote:
Hi all !

My name is Gabi, I'm a medical student trying to create an interactive representation of connectomes ("wires of the brain"). I though that making it with Bokeh would let me generate them on the fly or even create HTML reports that I could share online. I've been working intensively with Bokeh for a couple of week so far, here is the evolution of the project:

Right now the graph is composed of arcs and bezier curves. The main Idea, now that the glyphs have been generated, is adding some interaction to them. I wanted to use the hover tool to show information about the glyphs (the arcs) and tap (on the arcs too) for styling the bezier curves, like alpha=0.

I've seen that hover tool is not working on arcs right now, so i thought that tapping could make it, even if I had to implement it in JS.

I've tried reading from documentation, modifying examples and looking in Stack Overflow, but I haven't manage to get it working. So here are my questions and I hope someone can help me:

  • Does 'tap' work in arcs?
  • If yes, how can I modify a style of other dataSourceColumn like the beziers ?
  • If no, is there any hack I can try ?
Some stats, In the first connectome I was creating more than 7.000 beziers, in the last graph, the amazing amount of 76.379 Bokeh rocks!!!!

Thanks!!
Gabi

--
You received this message because you are subscribed to the Google Groups "Bokeh Discussion - Public" group.
To unsubscribe from this group and stop receiving emails from it, send an email to [email protected].
To post to this group, send email to [email protected].
To view this discussion on the web visit https://groups.google.com/a/continuum.io/d/msgid/bokeh/8ccc682c-45d0-481c-aa20-39272254f53b%40continuum.io\.
For more options, visit https://groups.google.com/a/continuum.io/d/optout\.

Hi there again,

It’s been a while since I wrote last time, I’ve been trying to understand what is happening in the _hit_point() you told me to focus on, and I’m a little bit lost. I’ve seen the definition in several places, but I’m not sure when it’s called and how.

A colleague that knows much more coffescript than me is willing to help, but we would need some help to understand what is happening so we can help to implement it in the arc glyph.

As always, thanks a lot!

Gabi

···

From my little (or None) understading, the functions receives the geometry of the glyph, and using the x and y from the mouse (i guess), tries to check if the distance is 0 (or something like that) and if it is, it return something (a boolean maybe ?).

On Tuesday, October 6, 2015 at 3:03:26 PM UTC+2, Bryan Van de ven wrote:

Gabi,

Awesome! Let us know any questions or help we can give. Best place to start is here:

    [http://bokeh.pydata.org/en/latest/docs/dev_guide/building.html](http://bokeh.pydata.org/en/latest/docs/dev_guide/building.html)

Which details how to build Bokeh from a source checkout.

Bryan

On Oct 6, 2015, at 3:22 AM, Gabriel de Maeztu [email protected] wrote:

Thanks Bryan, pwang and Damian!

Thanks for the tip, I’ll start a PR with the modifications to add _hit_point to arc’s first. I don’t know coffescript at all, but i’ll do my best, I hope you can correct any strange thing I do.

Once finished, I was thinking on implementing the graph in the charting interface as all it needs right know is a n-dimensional symmetric array.

Thanks for your help, I hope to see some support on my PR as CS is not my background,

Bests

Gabi

On Wednesday, September 30, 2015 at 11:27:12 PM UTC+2, Gabriel de Maeztu wrote:

Hi all !

My name is Gabi, I’m a medical student trying to create an interactive representation of connectomes (“wires of the brain”). I though that making it with Bokeh would let me generate them on the fly or even create HTML reports that I could share online. I’ve been working intensively with Bokeh for a couple of week so far, here is the evolution of the project:

Right now the graph is composed of arcs and bezier curves. The main Idea, now that the glyphs have been generated, is adding some interaction to them. I wanted to use the hover tool to show information about the glyphs (the arcs) and tap (on the arcs too) for styling the bezier curves, like alpha=0.

I’ve seen that hover tool is not working on arcs right now, so i thought that tapping could make it, even if I had to implement it in JS.

I’ve tried reading from documentation, modifying examples and looking in Stack Overflow, but I haven’t manage to get it working. So here are my questions and I hope someone can help me:

    • Does 'tap' work in arcs?
    • If yes, how can I modify a style of other dataSourceColumn like the beziers ?
    • If no, is there any hack I can try ?

Some stats, In the first connectome I was creating more than 7.000 beziers, in the last graph, the amazing amount of 76.379 Bokeh rocks!!!

Thanks!!

Gabi


You received this message because you are subscribed to the Google Groups “Bokeh Discussion - Public” group.

To unsubscribe from this group and stop receiving emails from it, send an email to [email protected].

To post to this group, send email to [email protected].

To view this discussion on the web visit https://groups.google.com/a/continuum.io/d/msgid/bokeh/8ccc682c-45d0-481c-aa20-39272254f53b%40continuum.io.

For more options, visit https://groups.google.com/a/continuum.io/d/optout.

Hi Gabi,

If you see GlyphView class , _hit_point() is called in hit_test() function using meta programming. When a geometry object has a type of “point”, _hit_point() is called.

The geometry object is generated in HoverToolView or TapToolView .

So if you want to make Arc work, check the tools to set a geometry object and Arc class to have _hit_point() function through hit_test() function.

Does it make sense? I will appreciate any feedbacks from you guys. Thanks!

···

On Monday, 2 November 2015 20:26:52 UTC+1, Gabriel de Maeztu wrote:

Hi there again,

It’s been a while since I wrote last time, I’ve been trying to understand what is happening in the _hit_point() you told me to focus on, and I’m a little bit lost. I’ve seen the definition in several places, but I’m not sure when it’s called and how.

From my little (or None) understading, the functions receives the geometry of the glyph, and using the x and y from the mouse (i guess), tries to check if the distance is 0 (or something like that) and if it is, it return something (a boolean maybe ?).

A colleague that knows much more coffescript than me is willing to help, but we would need some help to understand what is happening so we can help to implement it in the arc glyph.

As always, thanks a lot!

Gabi

On Tuesday, October 6, 2015 at 3:03:26 PM UTC+2, Bryan Van de ven wrote:

Gabi,

Awesome! Let us know any questions or help we can give. Best place to start is here:

    [http://bokeh.pydata.org/en/latest/docs/dev_guide/building.html](http://bokeh.pydata.org/en/latest/docs/dev_guide/building.html)

Which details how to build Bokeh from a source checkout.

Bryan

On Oct 6, 2015, at 3:22 AM, Gabriel de Maeztu [email protected] wrote:

Thanks Bryan, pwang and Damian!

Thanks for the tip, I’ll start a PR with the modifications to add _hit_point to arc’s first. I don’t know coffescript at all, but i’ll do my best, I hope you can correct any strange thing I do.

Once finished, I was thinking on implementing the graph in the charting interface as all it needs right know is a n-dimensional symmetric array.

Thanks for your help, I hope to see some support on my PR as CS is not my background,

Bests

Gabi

On Wednesday, September 30, 2015 at 11:27:12 PM UTC+2, Gabriel de Maeztu wrote:

Hi all !

My name is Gabi, I’m a medical student trying to create an interactive representation of connectomes (“wires of the brain”). I though that making it with Bokeh would let me generate them on the fly or even create HTML reports that I could share online. I’ve been working intensively with Bokeh for a couple of week so far, here is the evolution of the project:

Right now the graph is composed of arcs and bezier curves. The main Idea, now that the glyphs have been generated, is adding some interaction to them. I wanted to use the hover tool to show information about the glyphs (the arcs) and tap (on the arcs too) for styling the bezier curves, like alpha=0.

I’ve seen that hover tool is not working on arcs right now, so i thought that tapping could make it, even if I had to implement it in JS.

I’ve tried reading from documentation, modifying examples and looking in Stack Overflow, but I haven’t manage to get it working. So here are my questions and I hope someone can help me:

    • Does 'tap' work in arcs?
    • If yes, how can I modify a style of other dataSourceColumn like the beziers ?
    • If no, is there any hack I can try ?

Some stats, In the first connectome I was creating more than 7.000 beziers, in the last graph, the amazing amount of 76.379 Bokeh rocks!!!

Thanks!!

Gabi


You received this message because you are subscribed to the Google Groups “Bokeh Discussion - Public” group.

To unsubscribe from this group and stop receiving emails from it, send an email to [email protected].

To post to this group, send email to [email protected].

To view this discussion on the web visit https://groups.google.com/a/continuum.io/d/msgid/bokeh/8ccc682c-45d0-481c-aa20-39272254f53b%40continuum.io.

For more options, visit https://groups.google.com/a/continuum.io/d/optout.

Thanks Taka I’ll check that and open a PR as soon as possible to get feedback and help on it.

Gabi

···

On Nov 2, 2015 9:12 PM, “Takayuki Sato” [email protected] wrote:

Hi Gabi,

If you see GlyphView class , _hit_point() is called in hit_test() function using meta programming. When a geometry object has a type of “point”, _hit_point() is called.

The geometry object is generated in HoverToolView or TapToolView .

So if you want to make Arc work, check the tools to set a geometry object and Arc class to have _hit_point() function through hit_test() function.

Does it make sense? I will appreciate any feedbacks from you guys. Thanks!

On Monday, 2 November 2015 20:26:52 UTC+1, Gabriel de Maeztu wrote:

Hi there again,

It’s been a while since I wrote last time, I’ve been trying to understand what is happening in the _hit_point() you told me to focus on, and I’m a little bit lost. I’ve seen the definition in several places, but I’m not sure when it’s called and how.

From my little (or None) understading, the functions receives the geometry of the glyph, and using the x and y from the mouse (i guess), tries to check if the distance is 0 (or something like that) and if it is, it return something (a boolean maybe ?).

A colleague that knows much more coffescript than me is willing to help, but we would need some help to understand what is happening so we can help to implement it in the arc glyph.

As always, thanks a lot!

Gabi

On Tuesday, October 6, 2015 at 3:03:26 PM UTC+2, Bryan Van de ven wrote:

Gabi,

Awesome! Let us know any questions or help we can give. Best place to start is here:

    [http://bokeh.pydata.org/en/latest/docs/dev_guide/building.html](http://bokeh.pydata.org/en/latest/docs/dev_guide/building.html)

Which details how to build Bokeh from a source checkout.

Bryan

On Oct 6, 2015, at 3:22 AM, Gabriel de Maeztu [email protected] wrote:

Thanks Bryan, pwang and Damian!

Thanks for the tip, I’ll start a PR with the modifications to add _hit_point to arc’s first. I don’t know coffescript at all, but i’ll do my best, I hope you can correct any strange thing I do.

Once finished, I was thinking on implementing the graph in the charting interface as all it needs right know is a n-dimensional symmetric array.

Thanks for your help, I hope to see some support on my PR as CS is not my background,

Bests

Gabi

On Wednesday, September 30, 2015 at 11:27:12 PM UTC+2, Gabriel de Maeztu wrote:

Hi all !

My name is Gabi, I’m a medical student trying to create an interactive representation of connectomes (“wires of the brain”). I though that making it with Bokeh would let me generate them on the fly or even create HTML reports that I could share online. I’ve been working intensively with Bokeh for a couple of week so far, here is the evolution of the project:

Right now the graph is composed of arcs and bezier curves. The main Idea, now that the glyphs have been generated, is adding some interaction to them. I wanted to use the hover tool to show information about the glyphs (the arcs) and tap (on the arcs too) for styling the bezier curves, like alpha=0.

I’ve seen that hover tool is not working on arcs right now, so i thought that tapping could make it, even if I had to implement it in JS.

I’ve tried reading from documentation, modifying examples and looking in Stack Overflow, but I haven’t manage to get it working. So here are my questions and I hope someone can help me:

    • Does 'tap' work in arcs?
    • If yes, how can I modify a style of other dataSourceColumn like the beziers ?
    • If no, is there any hack I can try ?

Some stats, In the first connectome I was creating more than 7.000 beziers, in the last graph, the amazing amount of 76.379 Bokeh rocks!!!

Thanks!!

Gabi


You received this message because you are subscribed to the Google Groups “Bokeh Discussion - Public” group.

To unsubscribe from this group and stop receiving emails from it, send an email to [email protected].

To post to this group, send email to [email protected].

To view this discussion on the web visit https://groups.google.com/a/continuum.io/d/msgid/bokeh/8ccc682c-45d0-481c-aa20-39272254f53b%40continuum.io.

For more options, visit https://groups.google.com/a/continuum.io/d/optout.

You received this message because you are subscribed to the Google Groups “Bokeh Discussion - Public” group.

To unsubscribe from this group and stop receiving emails from it, send an email to [email protected].

To post to this group, send email to [email protected].

To view this discussion on the web visit https://groups.google.com/a/continuum.io/d/msgid/bokeh/b23ea5b5-cae6-4ff5-b92d-6716b7cc627a%40continuum.io.

For more options, visit https://groups.google.com/a/continuum.io/d/optout.

I’m trying to work using jupyter with the modified version of bokehJS I’m trying to create, but I think it’s not using the version I installed using the recommendations in the developer guides. Any clue ?

Thanks

···

On Tuesday, November 3, 2015 at 5:46:07 PM UTC+1, Gabriel de Maeztu wrote:

Thanks Taka I’ll check that and open a PR as soon as possible to get feedback and help on it.

Gabi

On Nov 2, 2015 9:12 PM, “Takayuki Sato” [email protected] wrote:

Hi Gabi,

If you see GlyphView class , _hit_point() is called in hit_test() function using meta programming. When a geometry object has a type of “point”, _hit_point() is called.

The geometry object is generated in HoverToolView or TapToolView .

So if you want to make Arc work, check the tools to set a geometry object and Arc class to have _hit_point() function through hit_test() function.

Does it make sense? I will appreciate any feedbacks from you guys. Thanks!

On Monday, 2 November 2015 20:26:52 UTC+1, Gabriel de Maeztu wrote:

Hi there again,

It’s been a while since I wrote last time, I’ve been trying to understand what is happening in the _hit_point() you told me to focus on, and I’m a little bit lost. I’ve seen the definition in several places, but I’m not sure when it’s called and how.

From my little (or None) understading, the functions receives the geometry of the glyph, and using the x and y from the mouse (i guess), tries to check if the distance is 0 (or something like that) and if it is, it return something (a boolean maybe ?).

A colleague that knows much more coffescript than me is willing to help, but we would need some help to understand what is happening so we can help to implement it in the arc glyph.

As always, thanks a lot!

Gabi

On Tuesday, October 6, 2015 at 3:03:26 PM UTC+2, Bryan Van de ven wrote:

Gabi,

Awesome! Let us know any questions or help we can give. Best place to start is here:

    [http://bokeh.pydata.org/en/latest/docs/dev_guide/building.html](http://bokeh.pydata.org/en/latest/docs/dev_guide/building.html)

Which details how to build Bokeh from a source checkout.

Bryan

On Oct 6, 2015, at 3:22 AM, Gabriel de Maeztu [email protected] wrote:

Thanks Bryan, pwang and Damian!

Thanks for the tip, I’ll start a PR with the modifications to add _hit_point to arc’s first. I don’t know coffescript at all, but i’ll do my best, I hope you can correct any strange thing I do.

Once finished, I was thinking on implementing the graph in the charting interface as all it needs right know is a n-dimensional symmetric array.

Thanks for your help, I hope to see some support on my PR as CS is not my background,

Bests

Gabi

On Wednesday, September 30, 2015 at 11:27:12 PM UTC+2, Gabriel de Maeztu wrote:

Hi all !

My name is Gabi, I’m a medical student trying to create an interactive representation of connectomes (“wires of the brain”). I though that making it with Bokeh would let me generate them on the fly or even create HTML reports that I could share online. I’ve been working intensively with Bokeh for a couple of week so far, here is the evolution of the project:

Right now the graph is composed of arcs and bezier curves. The main Idea, now that the glyphs have been generated, is adding some interaction to them. I wanted to use the hover tool to show information about the glyphs (the arcs) and tap (on the arcs too) for styling the bezier curves, like alpha=0.

I’ve seen that hover tool is not working on arcs right now, so i thought that tapping could make it, even if I had to implement it in JS.

I’ve tried reading from documentation, modifying examples and looking in Stack Overflow, but I haven’t manage to get it working. So here are my questions and I hope someone can help me:

    • Does 'tap' work in arcs?
    • If yes, how can I modify a style of other dataSourceColumn like the beziers ?
    • If no, is there any hack I can try ?

Some stats, In the first connectome I was creating more than 7.000 beziers, in the last graph, the amazing amount of 76.379 Bokeh rocks!!!

Thanks!!

Gabi


You received this message because you are subscribed to the Google Groups “Bokeh Discussion - Public” group.

To unsubscribe from this group and stop receiving emails from it, send an email to [email protected].

To post to this group, send email to [email protected].

To view this discussion on the web visit https://groups.google.com/a/continuum.io/d/msgid/bokeh/8ccc682c-45d0-481c-aa20-39272254f53b%40continuum.io.

For more options, visit https://groups.google.com/a/continuum.io/d/optout.

You received this message because you are subscribed to the Google Groups “Bokeh Discussion - Public” group.

To unsubscribe from this group and stop receiving emails from it, send an email to [email protected].

To post to this group, send email to [email protected].

To view this discussion on the web visit https://groups.google.com/a/continuum.io/d/msgid/bokeh/b23ea5b5-cae6-4ff5-b92d-6716b7cc627a%40continuum.io.

For more options, visit https://groups.google.com/a/continuum.io/d/optout.

Hi Gabi,

        I'm not sure if this is exa                  ctly what you're asking, but my

problem is that as I’m developing something in bokeh, sometimes I
want to test it out in the notebook.

          I've never come up with                 a

good solution for this. Hopefully some one has an elegant answer,
here’s my floundering around answer.

                                      In particular, in my

setup:

                  -                         bokeh is installed with

python setup.py develop so any python cha nges are automatically reflected and

                          -                               I'm

running gulp watch so my JS
is getting
rebuilt (but not minifi ed)
every time I run a script.

                                In

case you haven’t found
it, I use:

`from bokeh import _version``

  ``_version.get_versions()`

to confirm exactly which
version of Bokeh I’ve got in my notebook.

  Firstly, as a refresher we have the following options for

Resources: ‘inline’, ‘server’, ‘relative’, ‘cdn’, ‘absolute’.

  We don't want 'cdn' if we're doing local development. In the

notebook, ‘relative’ and ‘absolute’ will try and load versions
hosted by your notebook (something like localhost:8888) so that
doesn’t work. That leaves us with ‘server’ and ‘inline’.

  I have made both will work with a small tweak, I'm not sure if

this is the right thing to do, but it works.

  Under bokeh/server there may be a directory 'static'. You can

delete it, it’s not part of the repo. I then link this to the
directory where my bokehjs assets are getting built by gulp:

`$ cd bokeh/server

        $ ln -s ../../bokehjs/build static`</small>

After the the following uses of resources work fine for me in
my notebook (‘server’ or ‘inline’).

</small>

`from bokeh.resources import Resources``

  ``<small>          resources = Resources(mode='inline',

minified=False)``

  ``<small>output_notebook(resources=resources)</small>`
  After I make a change to python I need to restart the notebook

kernel for the change to be picked up.

  After I make a change to javascript I need to refresh the webpage

and re-run the cell with output_notebook in so my new version of
resources gets loaded.

  Would love to hear if anyone has a better way.

  Best,

  Bird

</small>
···

On 11/12/15 10:11 AM, Gabriel de Maeztu
wrote:

    I'm trying to work using jupyter with the modified

version of bokehJS I’m trying to create, but I think it’s not
using the version I installed using the recommendations in the
developer guides. Any clue ?

Thanks

      On Tuesday, November 3, 2015 at 5:46:07 PM UTC+1, Gabriel de

Maeztu wrote:

          Thanks Taka I'll check that and open a PR as soon as

possible to get feedback and help on it.

Gabi

          On Nov 2, 2015 9:12 PM, "Takayuki

Sato" [email protected] wrote:

Hi Gabi,

If you see GlyphView class , _hit_point()
is called in hit_test() function using meta
programming. When a geometry object has a type of
“point”, _hit_point() is called.

The geometry object is generated in HoverToolView or TapToolView .

So if you want to make Arc work, check the tools to set a geometry object and Arc class to have _hit_point() function through hit_test() function.

Does it make sense? I will appreciate any feedbacks from you guys. Thanks!

                On Monday, 2 November 2015 20:26:52 UTC+1, Gabriel

de Maeztu wrote:

Hi there again,

                      It's been a while since I wrote last time,

I’ve been trying to understand what is
happening in the _hit_point() you told me to
focus on, and I’m a little bit lost. I’ve seen
the definition in several places, but I’m not
sure when it’s called and how.

                      From my little (or None) understading, the

functions receives the geometry of the glyph,
and using the x and y from the mouse (i
guess), tries to check if the distance is 0
(or something like that) and if it is, it
return something (a boolean maybe ?).

                      A colleague that knows much more

coffescript than me is willing to help, but we
would need some help to understand what is
happening so we can help to implement it in
the arc glyph.

As always, thanks a lot!

Gabi

                    On Tuesday, October 6, 2015 at 3:03:26 PM UTC+2,

Bryan Van de ven wrote:

                      Gabi,


                      Awesome! Let us know any questions or help we

can give. Best place to start is here:

                              [http://bokeh.pydata.org/en/latest/docs/dev_guide/building.html](http://bokeh.pydata.org/en/latest/docs/dev_guide/building.html)


                      Which details how to build Bokeh from a source

checkout.

                      Bryan


                      > On Oct 6, 2015, at 3:22 AM, Gabriel de

Maeztu <[email protected] >
wrote:

                      >

                      > Thanks Bryan, pwang and Damian!

                      >

                      > Thanks for the tip, I'll start a PR with

the modifications to add _hit_point to arc’s
first. I don’t know coffescript at all, but
i’ll do my best, I hope you can correct any
strange thing I do.

                      > Once finished, I was thinking on

implementing the graph in the charting
interface as all it needs right know is a
n-dimensional symmetric array.

                      >

                      > Thanks for your help, I hope to see some

support on my PR as CS is not my background,

                      >

                      > Bests


                      > Gabi


                      >

                      >  


                      >

                      >

                      > On Wednesday, September 30, 2015 at

11:27:12 PM UTC+2, Gabriel de Maeztu wrote:

                      > Hi all !


                      >

                      > My name is Gabi, I'm a medical student

trying to create an interactive representation
of connectomes (“wires of the brain”). I
though that making it with Bokeh would let me
generate them on the fly or even create HTML
reports that I could share online. I’ve been
working intensively with Bokeh for a couple of
week so far, here is the evolution of the
project:

                      >

                      >

                      >

                      >

                      >

                      >

                      >

                      >

                      >

                      >

                      >

                      >

                      >

                      >

                      >

                      >

                      >

                      > Right now the graph is composed of arcs

and bezier curves. The main Idea, now that the
glyphs have been generated, is adding some
interaction to them. I wanted to use the hover
tool to show information about the glyphs (the
arcs) and tap (on the arcs too) for styling
the bezier curves, like alpha=0.

                      >

                      >

                      >

                      > I've seen that hover tool is not working

on arcs right now, so i thought that tapping
could make it, even if I had to implement it
in JS.

                      >

                      >

                      >

                      > I've tried reading from documentation,

modifying examples and looking in Stack
Overflow, but I haven’t manage to get it
working. So here are my questions and I hope
someone can help me:

                      >

                      >

                      >         • Does 'tap' work in arcs?


                      >         • If yes, how can I modify a

style of other dataSourceColumn like the
beziers ?

                      >         • If no, is there any hack I can

try ?

                      > Some stats, In the first connectome I was

creating more than 7.000 beziers, in the last
graph, the amazing amount of 76.379 Bokeh
rocks!!!

                      >

                      >

                      >

                      > Thanks!!


                      > Gabi


                      >

                      > --

                      > You received this message because you are

subscribed to the Google Groups “Bokeh
Discussion - Public” group.

                      > To unsubscribe from this group and stop

receiving emails from it, send an email to
.

To post to this group, send email to .
To view this discussion on the web visit
.
For more options, visit
            You received this message because you are subscribed to

the Google Groups “Bokeh Discussion - Public” group.

            To unsubscribe from this group and stop receiving emails

from it, send an email to [email protected].

            To post to this group, send email to                 .

To view this discussion on the web visit

  You received this message because you are subscribed to the Google

Groups “Bokeh Discussion - Public” group.

  To unsubscribe from this group and stop receiving emails from it,

send an email to [email protected].

  To post to this group, send email to [email protected].

  To view this discussion on the web visit [](https://groups.google.com/a/continuum.io/d/msgid/bokeh/c934e197-b8e9-47cb-bdf3-f8f9d02908fd%40continuum.io?utm_medium=email&utm_source=footer)      .

For more options, visit .

[email protected]
[email protected]
https://groups.google.com/a/continuum.io/d/msgid/bokeh/8ccc682c-45d0-481c-aa20-39272254f53b%40continuum.io
https://groups.google.com/a/ continuum.io/d/optout.

                    [email protected]

https://groups.google.com/a/continuum.io/d/msgid/bokeh/b23ea5b5-cae6-4ff5-b92d-6716b7cc627a%40continuum.io.

            For more options, visit [https://groups.google.com/a/continuum.io/d/optout](https://groups.google.com/a/continuum.io/d/optout).

          [https://groups.google.com/a/continuum.io/d/msgid/bokeh/c934e197-b8e9-47cb-bdf3-f8f9d02908fd%40continuum.io](https://groups.google.com/a/continuum.io/d/msgid/bokeh/c934e197-b8e9-47cb-bdf3-f8f9d02908fd%40continuum.io)

https://groups.google.com/a/continuum.io/d/optout

Thanks Sarah! I’ll check it this weekend and let you know if worked for me.

Thanks again,

Gabi

···

On Thu, Nov 12, 2015 at 8:41 PM Sarah Bird [email protected] wrote:

Hi Gabi,

        I'm not sure if this is exa                  ctly what you're asking, but my

problem is that as I’m developing something in bokeh, sometimes I
want to test it out in the notebook.

          I've never come up with                 a

good solution for this. Hopefully some one has an elegant answer,
here’s my floundering around answer.

                                      In particular, in my

setup:

                  -                         bokeh is installed with

python setup.py develop so any python cha nges are automatically reflected and

                          -                               I'm

running gulp watch so my JS
is getting
rebuilt (but not minifi ed)
every time I run a script.

                                In

case you haven’t found
it, I use:

`from bokeh import _version``

  ``_version.get_versions()`

to confirm exactly which
version of Bokeh I’ve got in my notebook.

  Firstly, as a refresher we have the following options for

Resources: ‘inline’, ‘server’, ‘relative’, ‘cdn’, ‘absolute’.

  We don't want 'cdn' if we're doing local development. In the

notebook, ‘relative’ and ‘absolute’ will try and load versions
hosted by your notebook (something like localhost:8888) so that
doesn’t work. That leaves us with ‘server’ and ‘inline’.

  I have made both will work with a small tweak, I'm not sure if

this is the right thing to do, but it works.

  Under bokeh/server there may be a directory 'static'. You can

delete it, it’s not part of the repo. I then link this to the
directory where my bokehjs assets are getting built by gulp:

`$ cd bokeh/server

        $ ln -s ../../bokehjs/build static`</small>

After the the following uses of resources work fine for me in
my notebook (‘server’ or ‘inline’).

</small>

`from bokeh.resources import Resources``

  ``<small>          resources = Resources(mode='inline',

minified=False)``

  ``<small>output_notebook(resources=resources)</small>`
  After I make a change to python I need to restart the notebook

kernel for the change to be picked up.

  After I make a change to javascript I need to refresh the webpage

and re-run the cell with output_notebook in so my new version of
resources gets loaded.

  Would love to hear if anyone has a better way.


  Best,


  Bird


</small>
  On 11/12/15 10:11 AM, Gabriel de Maeztu > wrote:
    I'm trying to work using jupyter with the modified

version of bokehJS I’m trying to create, but I think it’s not
using the version I installed using the recommendations in the
developer guides. Any clue ?

Thanks

      On Tuesday, November 3, 2015 at 5:46:07 PM UTC+1, Gabriel de > > Maeztu wrote:
          Thanks Taka I'll check that and open a PR as soon as

possible to get feedback and help on it.

Gabi

          On Nov 2, 2015 9:12 PM, "Takayuki > > > Sato" <[email protected]> wrote:

Hi Gabi,

If you see GlyphView class , _hit_point()
is called in hit_test() function using meta
programming. When a geometry object has a type of
“point”, _hit_point() is called.

The geometry object is generated in HoverToolView or TapToolView .

So if you want to make Arc work, check the tools to set a geometry object and Arc class to have _hit_point() function through hit_test() function.

Does it make sense? I will appreciate any feedbacks from you guys. Thanks!

                On Monday, 2 November 2015 20:26:52 UTC+1, Gabriel > > > > de Maeztu wrote:

Hi there again,

                      It's been a while since I wrote last time,

I’ve been trying to understand what is
happening in the _hit_point() you told me to
focus on, and I’m a little bit lost. I’ve seen
the definition in several places, but I’m not
sure when it’s called and how.

                      From my little (or None) understading, the

functions receives the geometry of the glyph,
and using the x and y from the mouse (i
guess), tries to check if the distance is 0
(or something like that) and if it is, it
return something (a boolean maybe ?).

                      A colleague that knows much more

coffescript than me is willing to help, but we
would need some help to understand what is
happening so we can help to implement it in
the arc glyph.

As always, thanks a lot!

Gabi

                    On Tuesday, October 6, 2015 at 3:03:26 PM UTC+2, > > > > > Bryan Van de ven wrote:
                      Gabi,


                      Awesome! Let us know any questions or help we

can give. Best place to start is here:

                              [http://bokeh.pydata.org/en/latest/docs/dev_guide/building.html](http://bokeh.pydata.org/en/latest/docs/dev_guide/building.html)


                      Which details how to build Bokeh from a source

checkout.

                      Bryan


                      > On Oct 6, 2015, at 3:22 AM, Gabriel de > > > > > > Maeztu <[email protected]                          > > > > > > > wrote:


                      >

                      > Thanks Bryan, pwang and Damian!

                      >

                      > Thanks for the tip, I'll start a PR with

the modifications to add _hit_point to arc’s
first. I don’t know coffescript at all, but
i’ll do my best, I hope you can correct any
strange thing I do.

                      > Once finished, I was thinking on

implementing the graph in the charting
interface as all it needs right know is a
n-dimensional symmetric array.

                      >

                      > Thanks for your help, I hope to see some

support on my PR as CS is not my background,

                      >

                      > Bests


                      > Gabi


                      >

                      >  


                      >

                      >

                      > On Wednesday, September 30, 2015 at > > > > > > 11:27:12 PM UTC+2, Gabriel de Maeztu wrote:


                      > Hi all !


                      >

                      > My name is Gabi, I'm a medical student

trying to create an interactive representation
of connectomes (“wires of the brain”). I
though that making it with Bokeh would let me
generate them on the fly or even create HTML
reports that I could share online. I’ve been
working intensively with Bokeh for a couple of
week so far, here is the evolution of the
project:

                      >

                      >

                      >

                      >

                      >

                      >

                      >

                      >

                      >

                      >

                      >

                      >

                      >

                      >

                      >

                      >

                      >

                      > Right now the graph is composed of arcs

and bezier curves. The main Idea, now that the
glyphs have been generated, is adding some
interaction to them. I wanted to use the hover
tool to show information about the glyphs (the
arcs) and tap (on the arcs too) for styling
the bezier curves, like alpha=0.

                      >

                      >

                      >

                      > I've seen that hover tool is not working

on arcs right now, so i thought that tapping
could make it, even if I had to implement it
in JS.

                      >

                      >

                      >

                      > I've tried reading from documentation,

modifying examples and looking in Stack
Overflow, but I haven’t manage to get it
working. So here are my questions and I hope
someone can help me:

                      >

                      >

                      >         • Does 'tap' work in arcs?


                      >         • If yes, how can I modify a

style of other dataSourceColumn like the
beziers ?

                      >         • If no, is there any hack I can

try ?

                      > Some stats, In the first connectome I was

creating more than 7.000 beziers, in the last
graph, the amazing amount of 76.379 Bokeh
rocks!!!

                      >

                      >

                      >

                      > Thanks!!


                      > Gabi


                      >

                      > --

                      > You received this message because you are

subscribed to the Google Groups “Bokeh
Discussion - Public” group.

                      > To unsubscribe from this group and stop

receiving emails from it, send an email to [email protected] .

                      > To post to this group, send email to [email protected]                          .


                      > To view this discussion on the web visit

https://groups.google.com/a/continuum.io/d/msgid/bokeh/8ccc682c-45d0-481c-aa20-39272254f53b%40continuum.io .

                      > For more options, visit [](https://groups.google.com/a/continuum.io/d/optout)[https://groups.google.com/a/](https://groups.google.com/a/)[continuum.io/d/optout](http://continuum.io/d/optout)                          .

            You received this message because you are subscribed to

the Google Groups “Bokeh Discussion - Public” group.

            To unsubscribe from this group and stop receiving emails

from it, send an email to [email protected].

            To post to this group, send email to [email protected].

            To view this discussion on the web visit [](https://groups.google.com/a/continuum.io/d/msgid/bokeh/b23ea5b5-cae6-4ff5-b92d-6716b7cc627a%40continuum.io?utm_medium=email&utm_source=footer)[https://groups.google.com/a/](https://groups.google.com/a/)[continuum.io/d/msgid/bokeh/b23ea5b5-cae6-4ff5-b92d-6716b7cc627a%40continuum.io](http://continuum.io/d/msgid/bokeh/b23ea5b5-cae6-4ff5-b92d-6716b7cc627a%40continuum.io).

            For more options, visit [https://groups.google.com/a/continuum.io/d/optout](https://groups.google.com/a/continuum.io/d/optout).

  You received this message because you are subscribed to the Google

Groups “Bokeh Discussion - Public” group.

  To unsubscribe from this group and stop receiving emails from it,

send an email to [email protected].

  To post to this group, send email to [email protected].

  To view this discussion on the web visit [](https://groups.google.com/a/continuum.io/d/msgid/bokeh/c934e197-b8e9-47cb-bdf3-f8f9d02908fd%40continuum.io?utm_medium=email&utm_source=footer)[https://groups.google.com/a/continuum.io/d/msgid/bokeh/c934e197-b8e9-47cb-bdf3-f8f9d02908fd%40continuum.io](https://groups.google.com/a/continuum.io/d/msgid/bokeh/c934e197-b8e9-47cb-bdf3-f8f9d02908fd%40continuum.io).

  For more options, visit [https://groups.google.com/a/continuum.io/d/optout](https://groups.google.com/a/continuum.io/d/optout).

You received this message because you are subscribed to the Google Groups “Bokeh Discussion - Public” group.

To unsubscribe from this group and stop receiving emails from it, send an email to [email protected].

To post to this group, send email to [email protected].

To view this discussion on the web visit https://groups.google.com/a/continuum.io/d/msgid/bokeh/5644EB6D.6020402%40gmail.com.

For more options, visit https://groups.google.com/a/continuum.io/d/optout.

Gabi de Maeztu Pontevia
Data Science Intern
Arc de San Silvestre 4, entresuelo segunda
08003 Barcelona, Spain
ES +34 616 754 011
[email protected]
www.mint-labs.com